
Executive Summary
A Saudi e-commerce store selling coffee and related products was investing approximately 50,000 SAR per month in paid acquisition, but the website was converting only 0.8% of its visitors into customers
The business did not have a traffic problem alone. It had a conversion-efficiency problem
Visitors were reaching the store, viewing products, and interacting with the website, but too many were leaving before completing a purchase
Mersad built a structured Conversion Rate Optimization program combining quantitative analysis, qualitative research, UX improvements, merchandising, customer journey optimization, and continuous experimentation
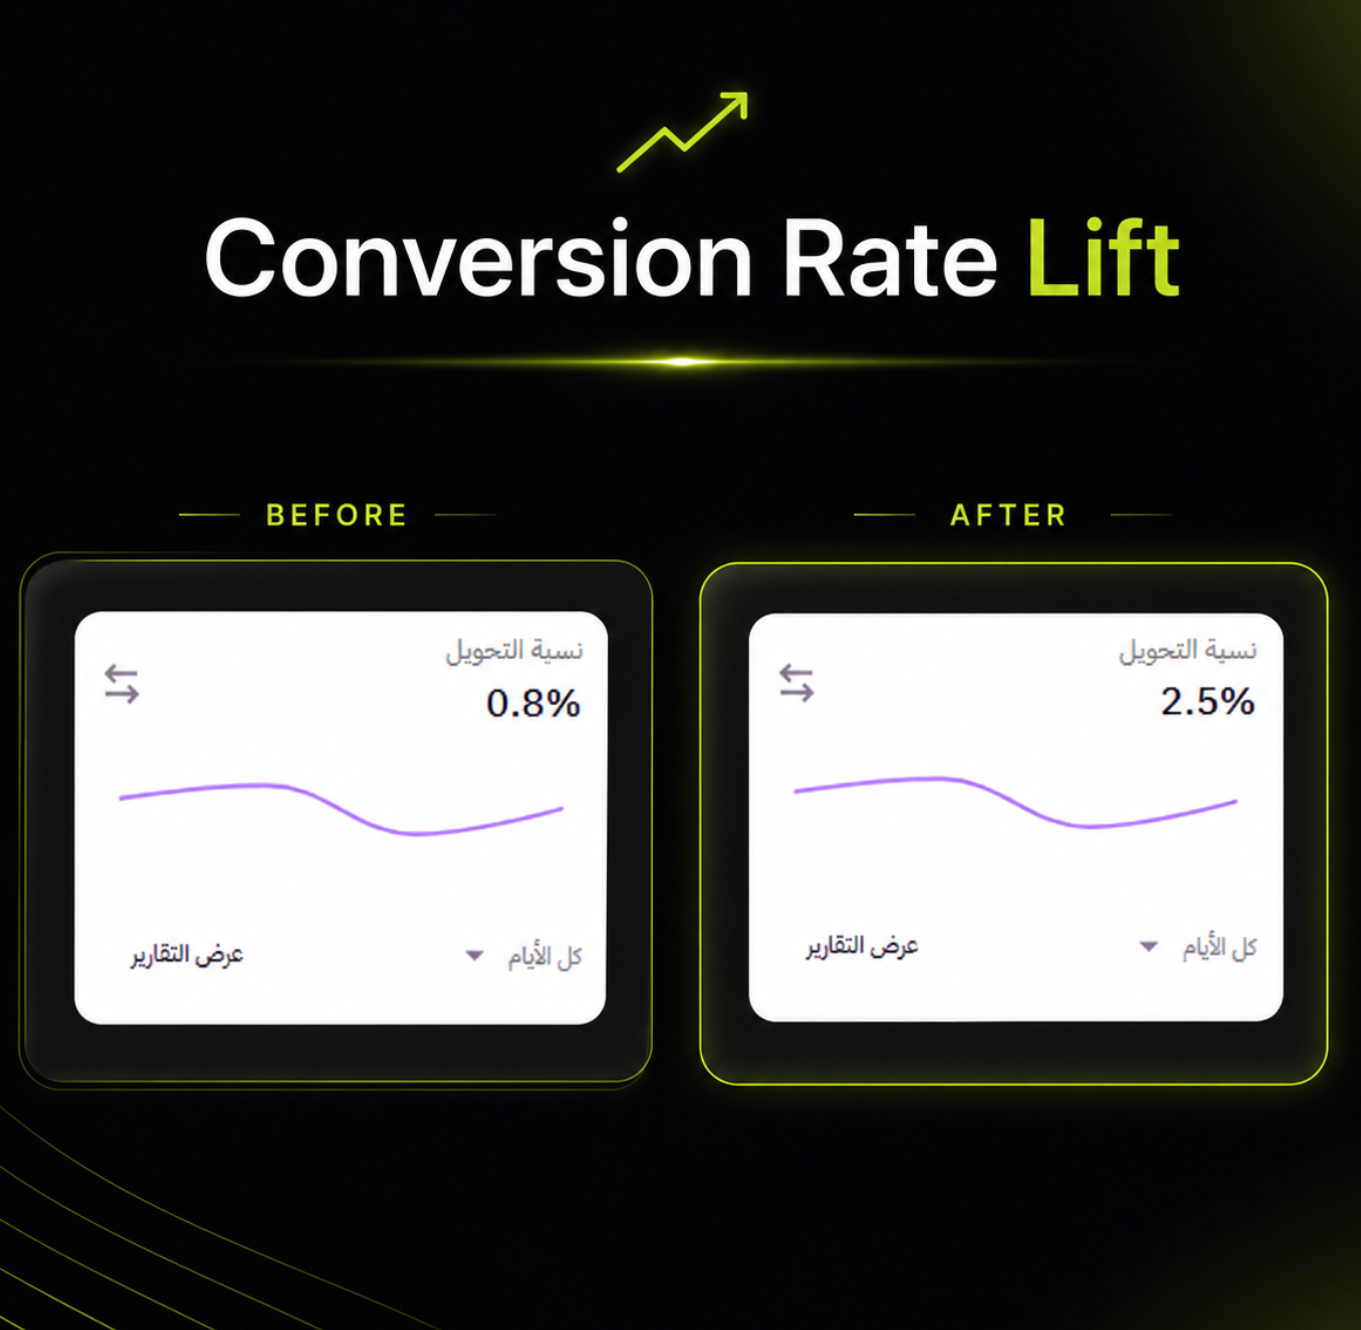
The program increased the store’s conversion rate from 0.8% to 2.5%, representing a relative uplift of 212.5%
Across the program, 85 experiments were launched, with 70 recorded as winning outcomes
Based on an average order value of 200 SAR, the conversion improvement significantly increased the commercial value generated from the same acquisition investment
Client Context
The client operates a Saudi e-commerce store on Zid, selling coffee products to customers across Saudi Arabia
The store was already investing in customer acquisition and generating consistent traffic, but the website was not converting enough of that traffic into purchases
The commercial challenge was not simply to increase traffic
The real opportunity was to improve the efficiency of the existing traffic and generate more revenue from the same media investment
Key business inputs included:
- 50,000 SAR monthly advertising spend
- 0.8% baseline conversion rate
- 200 SAR average order value
- Zid e-commerce platform
- Saudi Arabia as the primary market
- Paid traffic as a major acquisition channel
The Business Challenge
A low conversion rate was limiting the return generated from marketing spend
At a conversion rate of 0.8%, the business needed approximately 125 sessions to generate one purchase
After reaching a conversion rate of 2.5%, the store required approximately 40 sessions to generate one purchase
This change improved the store’s ability to convert existing traffic without requiring an equivalent increase in advertising spend
The main challenge was distributed across multiple parts of the customer journey rather than being caused by one isolated page
The optimization program therefore needed to investigate:
- جودة الـTraffic
- مدى ملاءمة صفحة الهبوط
- اكتشاف المنتجات
- Navigation and category structure
- قدرة صفحة المنتج على الإقناع
- Pricing and offer clarity
- Trust and reassurance
- Cart friction
- Checkout progression
- سهولة الاستخدام على الموبايل
- Technical performance
- Analytics and event tracking
Research Approach
Mersad started by separating confirmed evidence from assumptions
The team reviewed how visitors moved through the store and where the largest losses occurred across the funnel
The research program combined:
- GA4 funnel analysis
- Source and campaign segmentation
- Device-level performance
- Landing-page performance
- Product and category analysis
- New versus returning customer behavior
- Session Recordings
- Heatmaps
- On-site behavior
- UX and heuristic evaluation
- Mobile usability review
- Cart and checkout analysis
- Customer objections and trust gaps
- Product merchandising performance
- Experiment results
This allowed the team to identify whether performance problems originated from traffic, customer experience, product presentation, technical friction, or operational conditions
Key Findings
The research identified several areas where the store was losing purchase intent
Product Discovery Friction
Customers needed clearer routes to relevant products, categories, formats, and coffee preferences
Weak product discovery increases cognitive effort and forces users to browse more before finding a suitable option
Product Page Decision Friction
Some product pages did not present enough information above the fold to support a fast purchase decision
Users needed clearer visibility of:
- Product benefits
- Coffee characteristics
- Pricing
- Available variants
- توقعات التوصيل
- التقييمات
- المرتجعات
- وسائل الدفع
- The primary Add to Cart action
Weak Purchase Reassurance
Important trust information was not always visible at the moment customers needed it
Information about delivery, payment, freshness, returns, and product quality needed stronger placement across the buying journey
Mobile Experience Issues
A large portion of e-commerce traffic typically interacts through mobile devices, so small mobile usability problems can create significant commercial leakage
The program prioritized thumb-friendly interactions, clearer hierarchy, stronger CTA visibility, and reduced visual friction
الاحتكاك في السلة والـCheckout
Users reaching the cart were already demonstrating strong purchase intent
The cart experience needed to reduce hesitation, clarify the next action, and avoid introducing unnecessary decisions before checkout
Offer and Merchandising Clarity
Product positioning, bundles, recommendations, and value communication needed stronger commercial structure
The goal was not to use discounts indiscriminately, but to make the available value easier to understand
استراتيجية CRO
Mersad developed a prioritized optimization roadmap based on expected business impact, confidence, implementation effort, and urgency
The roadmap focused on five core workstreams:
1. Funnel Efficiency
Improving progression between:
- Landing page and product discovery
- Product view and Add to Cart
- Add to Cart and cart
- السلة و الـCheckout
- Checkout and purchase
2. Product Page Optimization
Strengthening:
- عرض القيمة
- Product hierarchy
- معلومات المنتج
- Reviews and trust signals
- Variant selection
- Mobile Add to Cart visibility
- Delivery and payment information
- Cross-sell opportunities
3. Navigation and Merchandising
Making product discovery easier through:
- Clearer category structure
- Improved product cards
- Better product recommendations
- Stronger product grouping
- More relevant upsells and cross-sells
4. Cart and Checkout Optimization
Reducing friction near the final purchase decision through:
- Clearer checkout actions
- Improved reassurance
- Better summary of the order
- Reduced distractions
- Stronger payment and delivery visibility
5. Experimentation
Testing high-priority hypotheses rather than relying on stakeholder opinions or generic best practices
Experimentation Program
The optimization roadmap was translated into a structured experimentation program
A total of 85 experiments were launched across different funnel stages
According to the recorded program results:
- 70 experiments produced winning outcomes
- 15 experiments did not outperform the control or required further validation
- Recorded win rate: 82.35%
Experiments focused on areas such as:
- عرض القيمة
- Hero messaging
- محتوى Product Card
- Product-page hierarchy
- Add to Cart visibility
- Trust signals
- Delivery communication
- Pricing presentation
- التقييمات
- Product recommendations
- Cart design
- Checkout actions
- Mobile user experience
- Offers and bundles
- التنقل
- Category merchandising
Not every change was treated as an A/B test
Obvious bugs, tracking problems, broken functionality, and severe usability blockers were implemented directly rather than being tested
Example Hypothesis
Because we observed that high-intent users were reaching product and cart pages but not progressing efficiently toward purchase, we believed that clarifying product value, strengthening trust information, and improving the visibility of primary actions for mobile and returning users would improve purchase conversion
We would know this was true when the variation increased completed purchases without negatively affecting average order value, checkout completion, or customer experience
Execution
The program was executed through continuous collaboration between CRO, Analytics, UX/UI, Development, Merchandising, and E-commerce Operations
Each optimization moved through a controlled workflow:
- Data collection
- Problem diagnosis
- Hypothesis development
- Prioritization
- UX and design preparation
- التطوير
- Tracking setup
- Quality assurance
- Experiment launch
- Result analysis
- Implementation or iteration
This structure helped ensure that ideas were not launched based on preference alone
Each experiment needed a clear business problem, supporting evidence, target audience, success metric, and implementation requirement
Conversion Rate Result
The conversion rate increased from:
0.8% → 2.5%This represents:
+1.7 percentage pointsand a relative uplift of:
+212.5%The store ultimately converted at approximately 3.125 times its previous rate
This meant the business generated substantially more orders from the same level of traffic
Order Impact
With an average order value of 200 SAR:
At a 0.8% conversion rate, every 10,000 sessions would generate approximately:
80 ordersEstimated revenue:
80 × 200 SAR = 16,000 SARAt a 2.5% conversion rate, the same 10,000 sessions would generate approximately:
250 ordersEstimated revenue:
250 × 200 SAR = 50,000 SARCommercial uplift per 10,000 sessions:
+170 additional orders
+34,000 SAR additional revenue
This calculation isolates the conversion effect and assumes traffic volume, average order value, pricing, and product mix remain stable
Projected Revenue Impact
The client was spending approximately 50,000 SAR per month on advertising
Because the original revenue or ROAS was not provided, the following scenario uses an illustrative baseline ROAS of 2.0 to demonstrate the financial impact
Before CRO
- Monthly ad spend: 50,000 SAR
- Illustrative ROAS: 2.0
- Estimated monthly revenue: 100,000 SAR
- Average order value: 200 SAR
- Estimated monthly orders: 500
After CRO
If traffic quality, order value, prices, and media efficiency remained stable, applying the 3.125× conversion multiplier would produce:
- Projected monthly revenue: 312,500 SAR
- Projected monthly orders: approximately 1,563
- Projected ROAS: 6.25
- Incremental monthly revenue: approximately 212,500 SAR
These figures are projections, not confirmed client results, until validated against actual revenue, order, traffic, and media data
الأثر التجاري
The program changed the economics of customer acquisition
Instead of depending only on additional advertising spend, the business generated more value from traffic it was already paying to acquire
Potential commercial effects included:
- Higher revenue from existing traffic
- Improved ROAS
- Lower effective cost per order
- More efficient marketing investment
- Stronger purchase conversion
- Customer Experience أفضل
- Improved scalability
- Reduced revenue leakage across the funnel
The most important result was not simply the increase in conversion rate
The business created a stronger foundation for profitable growth because every future session had a higher probability of becoming a customer
What Made the Program Work
The result did not come from one redesign or one successful test
It came from a continuous optimization system combining:
- تحليل البيانات
- سلوك المستخدم
- علم النفس السلوكي
- تجربة المستخدم (UX)
- الاختبارات والتجارب
- الترويج وترتيب المنتجات (Merchandising)
- التطوير
- Business strategy
The team did not assume that every problem was caused by design
Traffic quality, product mix, customer segment, technical performance, pricing, promotions, stock, delivery, and payment conditions were considered before conclusions were made
Key Learnings
Traffic Growth Alone Is Not Enough
Increasing traffic without improving conversion efficiency can increase costs faster than revenue
CRO Improves Marketing Economics
When the same traffic converts at a higher rate, the value generated from advertising can increase without an equivalent increase in media spend
Funnel Problems Are Connected
Homepage, product discovery, product pages, cart, and checkout should not be optimized in isolation
A weakness in one stage affects the performance of the entire customer journey
Experimentation Requires a System
Testing random design ideas does not create a reliable optimization program
Strong experimentation requires evidence, prioritization, tracking, QA, statistical analysis, and business interpretation
Commercial Metrics Matter
Conversion rate should not be evaluated alone
Revenue, AOV, orders, profitability, customer mix, and implementation cost must also be considered
الخلاصة
Mersad helped the Saudi coffee store transform its website from a low-efficiency sales channel into a stronger commercial growth engine
The conversion rate increased from 0.8% to 2.5%, representing a relative uplift of 212.5%
Across 85 recorded experiments, 70 generated winning outcomes
The program demonstrated how a structured CRO approach can improve customer experience, strengthen marketing efficiency, and create significantly more revenue from existing traffic
Rather than relying only on additional advertising spend, the brand improved the ability of its website to convert demand into measurable business growth
Ready to Improve Your Store’s Conversion Efficiency?
Mersad helps e-commerce brands identify revenue leakage, improve customer journeys, and increase commercial performance through analytics, UX research, experimentation, and e-commerce strategy
Book a Growth Call to identify where your store is losing revenue and which opportunities should be prioritized first