Meta Title: E-commerce Traffic but No Sales? Complete Diagnostic Framework
Ecommerce Traffic But No Sales 2026 Diagnostic Guide
Meta Description: Getting traffic but no sales? Learn how to diagnose traffic quality, product pages, cart, checkout, tracking, and conversion leaks using a practical ecommerce framework.
Getting more traffic should create more sales.
But sometimes it doesn’t.
Sessions increase. Paid campaigns keep sending visitors. Organic traffic starts growing. Product pages are receiving views.
Revenue barely moves.
The instinctive response is usually one of three things:
Increase ad spend.
Redesign the website.
Launch another promotion.
All three can make the situation worse if you haven’t identified the actual problem first.
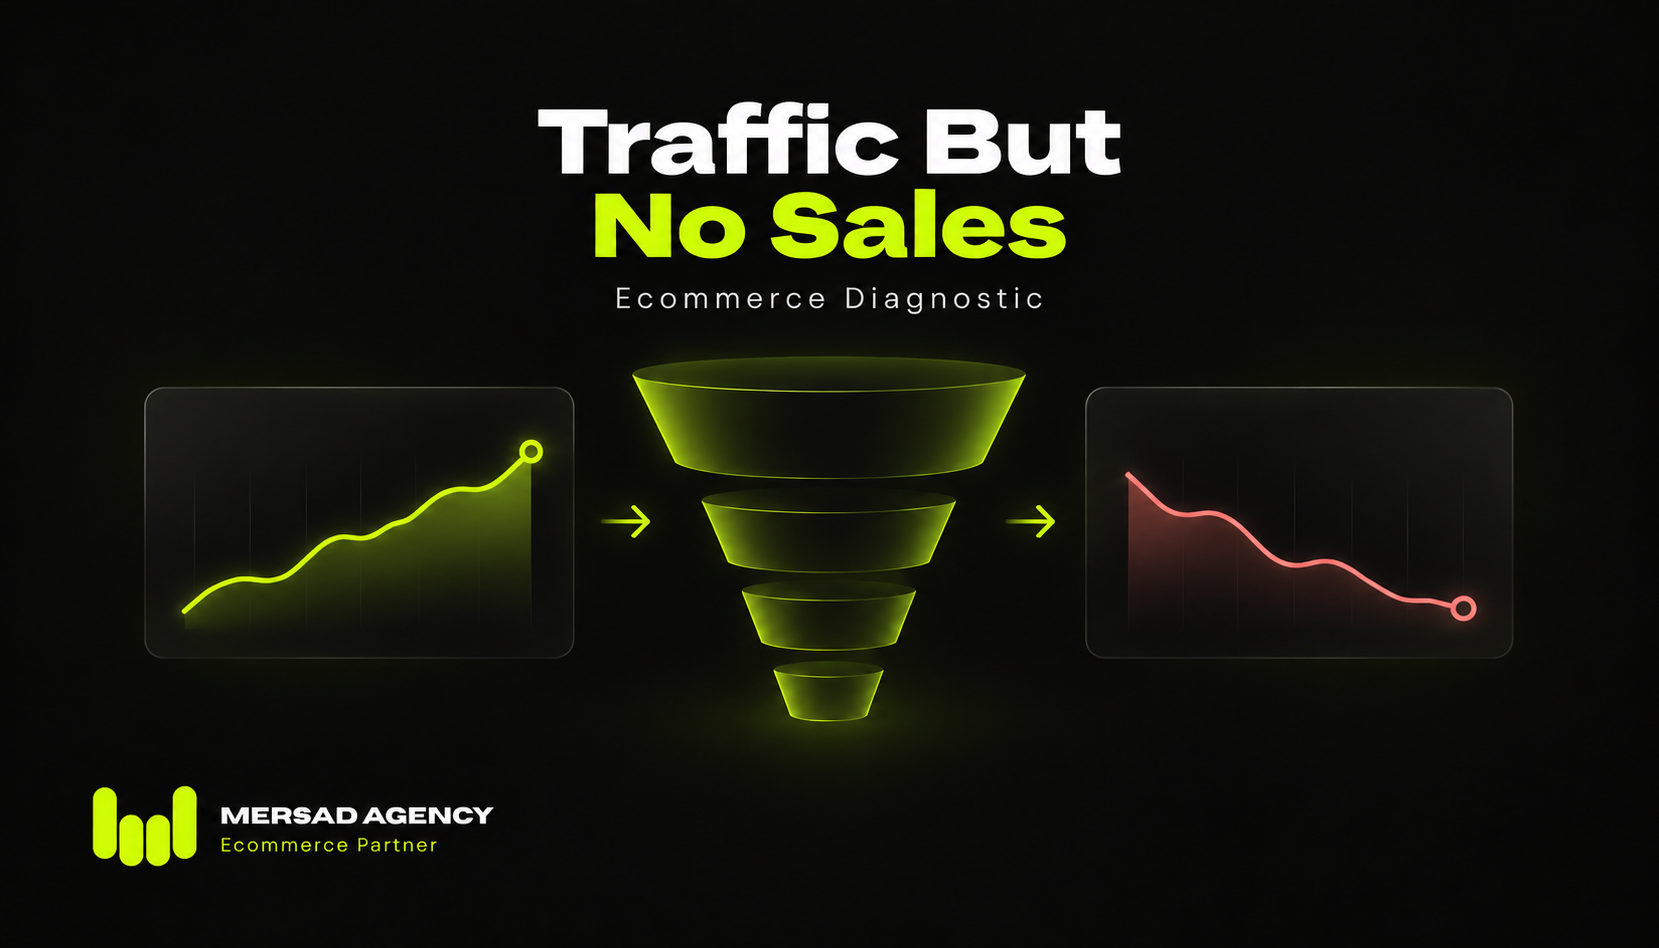
Because “traffic but no sales” is not a diagnosis. It is a symptom.
The real problem could be traffic quality, landing-page mismatch, weak product discovery, poor product pages, pricing, unavailable variants, checkout friction, payment failures, unexpected delivery costs, mobile UX, broken tracking—or several of these at the same time.
The purpose of this framework is to help you stop guessing and identify where revenue is actually leaking.
Start With the Funnel, Not the Website
ecommerce traffic but no sales is the main topic of this guide. The analysis below focuses on the evidence to review, the customer journey signals to compare, and the actions worth prioritizing by commercial impact.
Before changing your design, copy, pricing, ads, or checkout, map the journey that leads to a purchase.
A simplified ecommerce funnel looks like this:
Session → Product View → Add to Cart → Begin Checkout → Purchase
Depending on your store, you may want additional stages such as:
Landing Page → Collection View → Product View → Add to Cart → Cart → Checkout → Payment → Purchase
The important part is not the exact number of stages.
The important part is measuring the movement between them.
Shopify’s current guidance recommends the same stage-by-stage approach: compare traffic to product views, product views to cart activity, cart to checkout, and checkout to purchase to identify the actual leak rather than treating low conversion as one general problem.
Consider these two stores.
Store A
100,000 sessions
20,000 product views
4,000 add to carts
2,800 checkout starts
2,000 purchases
Store B
100,000 sessions
20,000 product views
4,000 add to carts
2,800 checkout starts
400 purchases
They have identical traffic until the checkout.
Telling Store B to “get better traffic” would miss the problem entirely.
The first question therefore isn’t:
Why aren’t people buying?
It is:
At which stage does buying intent disappear?
Step 1: Make Sure the Data Is Trustworthy
Before diagnosing conversion, make sure you aren’t diagnosing broken measurement.
This step gets skipped constantly.
Your analytics can show declining conversion even when the business itself hasn’t changed—or hide a real decline—if purchase events, consent settings, referral handling, payment redirects, or ecommerce events are misconfigured.
Before making decisions, validate:
- Sessions are being recorded consistently.
- Product views fire on the correct pages.
add_to_cartisn’t firing multiple times.begin_checkoutrepresents an actual checkout start.- Purchases fire only after successful orders.
- Transactions aren’t duplicated.
- Payment gateway redirects aren’t creating attribution problems.
- Internal traffic is filtered where appropriate.
- Store orders and GA4 purchases are reasonably reconcilable.
Do a simple sanity check:
Store backend orders vs. GA4 purchases
They don’t need to match perfectly.
They should, however, tell approximately the same commercial story.
If your store reports 1,000 purchases and GA4 reports 430, don’t start optimizing the checkout based on GA4 yet.
Fix measurement first.
Step 2: Separate a Traffic Problem From a Conversion Problem
Traffic quantity and traffic quality are different things.
A campaign can generate 50,000 visits and still contribute almost nothing commercially.
Another source can generate 5,000 visits and drive a meaningful percentage of revenue.
So don’t start with total sessions.
Break traffic down by:
Source / Medium
Paid Search
Paid Social
Organic Search
Direct
البريد الإلكتروني
Referral
Organic Social
Then compare for each source:
Sessions
Engaged sessions
مشاهدات المنتجات
معدل الإضافة إلى السلة
معدل بدء الـCheckout
معدل إتمام الشراء
الإيرادات
Revenue per session
Now patterns become visible.
Imagine this:
| Channel | Sessions | Purchase CR | الإيرادات |
|---|---|---|---|
| Paid Search | 12,000 | 3.1% | $42,000 |
| Paid Social | 48,000 | 0.4% | $21,000 |
| البريد الإلكتروني | 4,000 | 5.2% | $18,000 |
| Organic Search | 16,000 | 2.0% | $31,000 |
Looking only at sessions makes Paid Social look like your biggest channel.
Looking at conversion efficiency tells a very different story.
This doesn’t automatically mean the Paid Social team is doing something wrong.
It might be prospecting traffic with lower intent.
The landing page might not match the campaign.
The product mix may differ.
The audience may be new customers while email traffic consists mostly of existing customers.
The job of analysis is to identify the difference before assigning the cause.
Step 3: Check Whether Traffic Intent Matches the Page
Not every visit is a shopping visit.
Someone searching:
“how to choose running shoes”
has a different intent from someone searching:
“buy men’s running shoes size 44”
Both visits count as traffic.
Their expected conversion behavior should not be identical.
This is where Search Console becomes extremely useful.
Google Search Console’s Performance report lets you inspect the queries that generate impressions and clicks and compare performance by query and page.
For your highest-traffic organic landing pages, ask:
- What queries actually bring people here?
- Are those queries informational, commercial, or transactional?
- Does the landing page satisfy that intent?
- Is there a logical next step toward a product or category?
- Are informational articles generating traffic without contributing to product discovery?
A traffic increase caused by informational content can be good for SEO while simultaneously reducing your site-wide conversion rate.
That doesn’t necessarily mean performance got worse.
It means your traffic mix changed.
This distinction matters.
Step 4: Check Landing-Page Message Match
Traffic can be qualified and still fail because the transition from acquisition to website is broken.
Imagine an ad promising:
“20% off linen shirts — this week only.”
The visitor clicks and lands on a generic homepage containing dozens of categories and no visible reference to linen shirts or the promotion.
The campaign generated the click.
The landing experience lost the intent.
For your largest campaigns, compare:
Ad promise → Landing-page headline → Product selection → Price / offer → CTA
They should feel like one continuous conversation.
ابحث عن:
- Ads sending users to the homepage unnecessarily.
- Promotion messaging missing from the landing page.
- Different pricing between campaign and page.
- Products in the campaign being difficult to find.
- Wrong geographic or language version.
- Mobile landing experiences that hide the promoted product.
- Out-of-stock products receiving paid traffic.
This is one of the fastest checks you can make because it requires no redesign.
Sometimes the problem isn’t page quality.
It’s page relevance.
Step 5: Find Where Product Discovery Breaks
Suppose traffic lands correctly, but very few visitors reach product pages.
You now have a discovery problem.
راجع:
Session → Category / Search → Product View
Investigate:
التنقل
Collections
Categories
Internal search
الفلاتر
الترتيب
الترويج وترتيب المنتجات (Merchandising)
Product recommendations
Questions worth answering:
- Which landing pages generate the most sessions but the fewest product views?
- Which categories get traffic but low product clicks?
- What do visitors search for internally?
- Which internal searches return zero or poor results?
- هل مهم الفلاتر مفقود؟
- Are sold-out products dominating top positions?
- Is merchandising aligned with actual demand?
- Do mobile visitors see enough products above the fold?
If people can’t efficiently reach relevant products, changing the checkout won’t help.
Step 6: Diagnose the Product Page Using Add-to-Cart Behavior
The Product Page is where interest becomes purchase intent.
That makes the relationship between:
Product View → Add to Cart
extremely useful.
Start by creating a product-level table containing:
المنتج
مشاهدات المنتجات
الإضافات إلى السلة
ATC المعدل
Checkout starts
المشتريات
Product conversion rate
الإيرادات
Stock status
Now sort by Product Views descending.
You are looking for expensive missed opportunities:
High Views + High Sales
These are your winners.
Understand what makes them work and protect their visibility.
Low Views + High Conversion
These products may have a discovery or merchandising opportunity.
More qualified exposure could matter.
High Views + Low Add to Cart
These deserve investigation.
Possible issues include:
Price perception
Weak imagery
Insufficient product information
Size uncertainty
توفر الـVariants
Delivery uncertainty
Return uncertainty
Weak value communication
Poor mobile UX
Mismatch between acquisition promise and actual product
High Views + Zero Revenue
These should immediately attract attention.
But don’t automatically redesign the page.
First check:
Stock.
Variants.
Tracking.
Traffic source.
Price.
Geography.
Campaign targeting.
A high-traffic, zero-revenue product can represent a CRO opportunity—or simply irrelevant traffic.
Step 7: Don’t Ask “Is the Product Page Good?”
Ask Better Questions.
A visual review alone is not enough.
Instead ask:
Can the customer answer the questions required to buy?
For many ecommerce products, that means understanding:
What exactly am I getting?
Why is this product right for me?
What size or variant should I choose?
How does it look or work in real life?
When will I receive it?
Can I return it?
Do other customers trust it?
Why should I buy this product instead of another option?
What happens if something goes wrong?
Product-page optimization should reduce decision uncertainty, not simply add more sections.
More content isn’t automatically better.
Better information at the correct moment is.
Step 8: Use Behavioral Data to Explain the Numbers
Analytics tells you أين something is happening.
It usually doesn’t tell you لماذا.
Once you’ve located an abnormal stage or page, add qualitative evidence.
تشمل المدخلات المفيدة:
Session Recordings
Heatmaps
استبيانات داخل الموقع
Customer support conversations
Search Data
Product Reviews
User Testing
Post-purchase surveys
Exit Surveys
على سبيل المثال:
Analytics says mobile Product A has unusually low ATC.
Session recordings show repeated taps on the size selector.
Support tickets contain questions about sizing.
Now you have a much stronger hypothesis:
Size-selection uncertainty may be suppressing mobile add-to-cart behavior on Product A.
That’s materially different from:
“We should redesign the product page.”
One is evidence-based.
The other is an opinion.
Step 9: If Add to Cart Is Healthy but Checkout Starts Are Weak, Inspect the Cart
A customer adding a product to their cart has shown meaningful intent.
If many of those users never begin checkout, investigate the cart experience.
ابحث عن:
Unexpected costs
Confusing totals
Poor delivery visibility
Distracting upsells
Coupon-code anxiety
Missing payment information
Weak checkout CTA hierarchy
Cart errors
Variant inconsistencies
Forced account behavior
Mobile usability problems
Also check whether the cart is being used as a comparison or saving mechanism.
Not every Add to Cart represents an immediate purchase intention.
Your job is to understand the behavior, not assume it.
Step 10: If Checkout Starts Are Healthy but Purchases Are Weak, Prioritize Checkout
The closer the user is to payment, the more commercially important the friction becomes.
Baymard’s ongoing checkout research places average documented cart abandonment around 70%, and its research repeatedly identifies controllable factors such as unexpected additional costs, forced account creation, overly complicated checkout flows, trust concerns, errors, and payment limitations. Shopify’s 2026 checkout guidance references the same categories.
Measure checkout step-by-step where your platform allows:
Checkout started
Contact information
Delivery / shipping
الدفع
Order completed
If 80% move from checkout to shipping but only 35% move from shipping to payment, investigate that transition first.
Possible causes include:
Shipping fees revealed too late.
Delivery estimates that are unacceptable.
Missing delivery areas.
Address-validation problems.
Mobile form usability.
Mandatory account creation.
Coupon behavior.
Unexpected tax.
Payment options.
Payment failures.
Technical errors.
Do not start by changing button colors.
Start with the largest measurable loss.
Step 11: Segment the Problem Before Calling It a Website Problem
A site-wide average can hide almost everything important.
Always try to segment by:
الجهاز
Mobile
Desktop
Tablet
Visitor type
New
العملاء العائدون
المنطقة الجغرافية
الدولة
Region
City where relevant
مصدر الـTraffic
Paid
Organic
البريد الإلكتروني
Direct
Referral
صفحة الهبوط
الصفحة الرئيسية
التصنيف
المنتج
Campaign landing page
Content
Product / category
Best seller
High-margin
New product
Discounted product
Out-of-stock-heavy category
على سبيل المثال:
Overall conversion rate drops from 2.1% to 1.7%.
That looks like a website problem.
But segmentation reveals:
Desktop: unchanged
Organic: unchanged
Returning users: unchanged
Paid Social mobile traffic: +85% sessions, 0.3% conversion
Now your diagnosis is entirely different.
The site didn’t necessarily “stop converting.”
The denominator changed.
Step 12: Check Operational Causes Before Redesigning Anything
Not every conversion decline comes from UX.
تحقق من:
توفر المخزون
Popular size availability
Price changes
Promotion changes
Shipping fees
Delivery SLA
Return policy
Payment options
Payment gateway performance
Seasonality
Product Mix — مقياس/مصطلح متخصص
Competitor promotions
Campaign mix
Imagine your bestselling sizes go out of stock.
Traffic stays constant.
Product views stay constant.
ATC falls.
Overall conversion declines.
A redesign doesn’t solve that.
Inventory does.
This is why CRO should never operate in isolation from ecommerce operations.
Step 13: Quantify the Revenue Opportunity
Once you find the weak stage, estimate how much it matters.
Suppose:
20,000 product views
Current ATC rate = 5%
Target scenario = 6%
Checkout completion = 45%
AOV = $80
Current:
20,000 × 5% = 1,000 carts
Potential:
20,000 × 6% = 1,200 carts
Incremental carts:
200
If 45% complete checkout:
200 × 45% = 90 additional orders
At $80 AOV:
90 × $80 = $7,200 potential incremental revenue
This is not a forecast or guarantee.
It is an opportunity model.
It tells you whether the problem is commercially important enough to prioritize.
Step 14: Prioritize Lower-Funnel Leakage Carefully
Imagine two issues:
Issue A:
Homepage → Product View is slightly weak.
Issue B:
Thousands of high-intent users begin checkout but fail at payment.
Issue B deserves urgent investigation.
Shopify’s 2026 funnel guidance similarly recommends prioritizing meaningful lower-funnel leaks because those visitors have already demonstrated stronger purchase intent.
A useful prioritization framework is:
Impact × Confidence ÷ Effort
الأثر:
How much revenue sits behind this problem?
Confidence:
How strong is the evidence that you’ve identified the real cause?
الجهد:
How difficult is the change?
Don’t prioritize by how visually obvious a problem looks.
Prioritize by expected business impact and quality of evidence.
A 30-Minute Ecommerce Diagnostic
If you only have 30 minutes, do this.
Minutes 0–5: Validate the commercial picture
قارن:
Sessions
Orders
الإيرادات
معدل التحويل
AOV
Current period vs previous comparable period.
Minutes 5–10: Build the funnel
مشاهدات المنتجات
Add to Carts
Checkout Starts
المشتريات
Calculate stage-to-stage rates.
Minutes 10–15: Segment the biggest drop
الجهاز
مصدر الـTraffic
صفحة الهبوط
New vs returning
Minutes 15–20: Inspect product performance
Identify:
High-traffic / low-ATC products
High-traffic / zero-sale products
Low-traffic / high-converting products
Minutes 20–25: Check operational factors
Stock
السعر
الخصومات
الشحن
Payments
Minutes 25–30: Create hypotheses
Not:
“Improve product pages.”
Instead:
“Mobile visitors from Campaign X reach Product Y at normal rates but Add to Cart is significantly weaker than desktop. Session recordings show repeated interaction with the variant selector. Investigate mobile variant selection as a potential friction point.”
That’s actionable.
The Diagnostic Matrix
When you see this:
Sessions ↓, Conversion Stable
Investigate acquisition.
Traffic volume is the first suspect.
Sessions ↑, Orders Flat
Investigate traffic quality and conversion efficiency.
Your growth in visitors isn’t translating into growth in buyers.
Product Views ↑, Add to Cart Flat
Investigate product pages, offer, product mix, pricing, availability, and audience fit.
Add to Cart ↑, Checkout Starts Flat
Investigate cart friction and cost transparency.
Checkout Starts ↑, Purchases Flat
Investigate checkout, shipping, payment, errors, and trust.
Conversion ↓ Only on Mobile
Investigate mobile UX and technical performance before making site-wide changes.
Conversion ↓ Only From One Channel
Investigate traffic quality and landing-page alignment before redesigning the entire store.
Revenue ↓ While Orders Are Stable
Investigate AOV, discounting, product mix, and pricing—not conversion.
Revenue ↑ While Conversion Falls
Don’t automatically panic.
Higher traffic or AOV may still be producing better commercial performance.
Understand the components before reacting to one KPI.
Don’t Optimize the Metric. Diagnose the System.
An ecommerce store is not one conversion rate.
It’s a system.
Acquisition determines who arrives.
Landing pages determine whether the promise continues.
Navigation and search determine whether they find something relevant.
Product pages determine whether interest becomes intent.
Cart and checkout determine whether intent becomes revenue.
Operations determine whether the offer is actually possible to buy.
Analytics determines whether you can see any of it accurately.
That’s why random CRO changes often produce random results.
The better process is:
Measure → Locate → Segment → Investigate → Hypothesize → Prioritize → Implement or Test → Measure again
Your Next Step
If your store has traffic but sales aren’t moving proportionally, don’t begin with another redesign or another campaign.
Start by answering three questions:
Where is the largest measurable drop?
Which segment is responsible for it?
What evidence explains why it happens?
Once you can answer those, your optimization roadmap becomes much clearer.
At Mersad, this is how we approach ecommerce performance: combining funnel data, traffic analysis, product performance, behavioral research, UX analysis, experimentation, and commercial context to identify where revenue is being lost—and what should be investigated first.
Need to understand where your store is losing revenue?
Explore Mersad’s ecommerce growth and CRO resources, or talk to us about a structured Funnel & Conversion Analysis.
الأسئلة الشائعة
Why does my ecommerce store get traffic but no sales?
Usually because the problem sits somewhere between traffic quality and purchase completion. Common areas to investigate include search or campaign intent, landing-page alignment, product discovery, product-page performance, cart friction, checkout, payment, stock, pricing, and tracking. The correct answer depends on where your own funnel shows the largest abnormal drop.
How do I convert website traffic into sales?
Start by identifying which stage loses the most qualified users. Improving conversion isn’t one tactic; it can require better traffic targeting, landing-page relevance, product information, merchandising, trust, cart experience, checkout, payments, or operational changes.
What is a good ecommerce conversion rate?
There is no universally “good” ecommerce conversion rate. Current benchmark datasets vary substantially by category, traffic source, device, price point, customer type, and methodology. Shopify’s 2026 guide explicitly recommends treating industry averages as context rather than targets and comparing your performance within the right commercial context.
How can I find where customers drop off?
Create an ecommerce funnel in GA4 or your commerce analytics platform and compare users between product view, add to cart, checkout, and purchase. Then segment the largest loss by device, source, landing page, product, and visitor type. GA4 Funnel Exploration is specifically designed for this type of stage-based analysis.
Should I increase traffic if my conversion rate is low?
Not automatically. If existing traffic is relevant but the store loses high-intent users later in the funnel, increasing acquisition may simply send more people into the same leak. Diagnose traffic quality and funnel efficiency first, then decide whether the next investment should go into acquisition or conversion.
Recommended internal links
Product Performance Matrix
Discount Profitability Calculator
CRO Services
E-commerce Analytics / Funnel Analysis
Product Page Optimization
تحسين Checkout
When reviewing ecommerce traffic but no sales, separate traffic volume from conversion efficiency before assigning a cause.
يجب أن يقسم تقرير ecommerce traffic but no sales diagnosis should be segmented by device, source, landing page, product or customer type whenever the data allows it.
Further Reading and Sources
Related Mersad insight Shopify لديه Traffic لكن بدون Sales: كيف تفصل مشاكل الترافيك عن Store Friction
External reference Baymard Ecommerce UX Research