Many ecommerce teams believe they have an experimentation program because they occasionally compare two versions of a page.
They change a button color.
Rewrite a headline.
Move customer reviews.
Add a sticky Add to Cart button.
Introduce urgency messaging.
Then wait for the experimentation platform to display a winner.
That process may technically qualify as an A/B test.
It does not automatically qualify as useful experimentation.
The commercial value of A/B testing does not come from creating two designs. It comes from reducing uncertainty around a business decision.
A strong ecommerce experiment should answer a specific question:
- Does reducing size uncertainty help more customers select a variant?
- Does showing delivery information earlier improve purchase progression?
- Does a clearer bundle structure increase revenue per visitor?
- Does guest checkout reduce abandonment without increasing fraud or support demand?
- Does a more representative product-list order improve product discovery?
- Does simplifying the payment step improve completed orders without reducing Average Order Value?
A weak test begins with a design idea.
A strong test begins with a validated problem, behavioral evidence, a defined audience, and a measurable hypothesis.
This guide explains how to build an ecommerce A/B testing process that produces evidence the business can actually use.
What Is A/B Testing in Ecommerce?
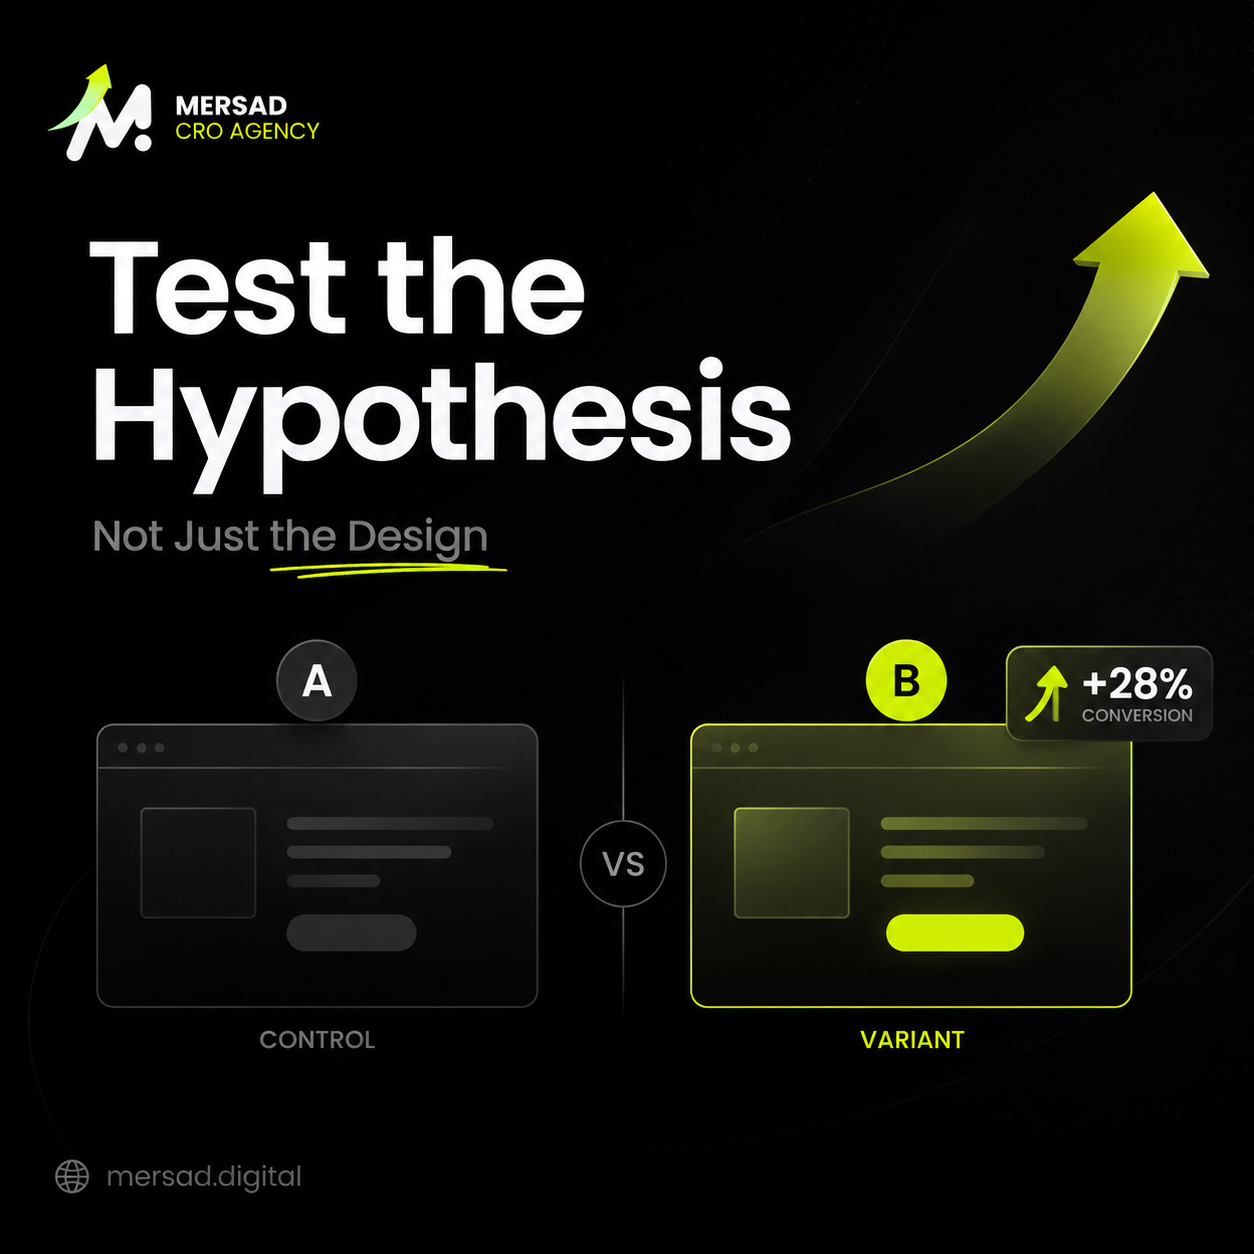
A/B testing is a controlled experiment in which eligible users are randomly assigned to different versions of an ecommerce experience.
The existing version is usually called the Control.
The modified version is called the Variant أو Treatment.
The business then compares customer behavior and commercial outcomes between the groups.
على سبيل المثال:
Control
Shipping information is hidden inside an accordion near the bottom of the Product Page.
Variant
A concise delivery estimate is displayed beside the Add to Cart button.
The purpose of the experiment is not simply to determine which version receives more clicks.
The purpose is to test whether earlier delivery information reduces uncertainty and helps customers progress toward purchase.
The measurement plan may include:
- Product View to Add to Cart Rate
- Checkout Start Rate
- Purchase Rate
- Revenue per Visitor
- Cancellation Rate
- Delivery-related support contacts
The experiment is therefore testing a behavioral and commercial hypothesis, not merely a layout preference.
Why Ecommerce A/B Testing Is Frequently Misused
The biggest problem in many experimentation programs is not the testing platform.
It is the thinking that happens before the test is launched.
Teams often begin with questions such as:
- What can we test this month?
- Which competitor feature should we copy?
- Can we test a green CTA?
- Should we add a countdown timer?
- Can we move the reviews higher?
- Should we reduce the number of checkout fields?
These may become useful ideas.
But they are not diagnoses.
Without evidence, the team does not know:
- Whether the problem actually exists
- Which customers experience it
- Which funnel stage is affected
- Why the proposed change may work
- What metric should improve
- What level of improvement matters
- What other metrics could be harmed
- Whether the store has enough traffic to answer the question
A test can be technically correct and still answer a commercially weak question.
Begin With Evidence, Not Inspiration
Reliable ecommerce experimentation usually starts with three evidence categories.
Quantitative Evidence
Quantitative data helps identify where performance is weak or where customer behavior changes.
Examples include:
- Low Product View to Add to Cart Rate
- High Add to Cart but low Checkout Start
- High mobile Checkout abandonment
- Weak Revenue per Product List Session
- Low completion of variant selection
- Conversion decline among first-time users
- High payment failure for a specific method
- High-traffic landing pages with low Revenue per Session
- Strong product interest but weak final purchase completion
Quantitative data shows where to investigate.
It does not always explain why the behavior occurs.
الأدلة الـQualitative
Qualitative research helps explain the behavior behind the metrics.
Useful sources include:
- Session Recordings
- Heatmaps
- مقابلات العملاء
- Onsite surveys
- Support Tickets
- Live chat conversations
- التقييمات
- أسباب الاسترجاع
- Onsite search queries
- Usability الاختبار
For example, GA4 may show that mobile visitors have a weak Product View to Add to Cart Rate.
Session Recordings may reveal that customers repeatedly open the Size Guide, return to the variant selector, and leave without selecting a size.
Support conversations may contain repeated questions about fit.
Return data may show a high percentage of size-related returns.
Together, these signals create a stronger evidence base than any one source alone.
Operational Evidence
Some apparent UX problems originate in ecommerce operations.
Examples include:
- Core sizes are unavailable
- Delivery takes longer than the website promises
- Popular payment methods are missing
- Promotions are configured incorrectly
- Product prices differ between pages
- Product feeds contain errors
- Inventory updates are delayed
- Tracking events are duplicated or missing
These issues should not automatically become A/B tests.
If a payment method is broken, fix it.
If the Add to Cart button does not work on a browser, fix it.
If the shipping information is incorrect, correct it.
If purchase tracking is missing, repair the tracking before interpreting performance.
A/B testing is used to compare valid alternatives under uncertainty.
It should not be used to decide whether an obvious defect should remain.
How to Write a Strong Ecommerce A/B Testing Hypothesis
A useful hypothesis connects five components:
- الأدلة
- Audience
- Proposed Change
- Behavioral mechanism
- Measurable outcome
A practical hypothesis format is:
Because we observed [evidence], we believe that [change] for [audience] will improve [metric] by addressing [behavioral mechanism]. We will know this is true when [success criteria].
Weak Hypothesis
Changing the Product Page CTA will increase conversion.
This statement does not explain:
- What problem was observed
- Which customers are affected
- Why the CTA is responsible
- Which conversion metric matters
- What result would justify rollout
Stronger Hypothesis
Because first-time mobile users repeatedly open the Size Guide and leave before selecting a size, we believe that displaying a concise fit recommendation beside the size selector will improve Product View to Add to Cart Rate by reducing size uncertainty. We will know this is true when Add to Cart improves without increasing size-related returns or support contacts.
The stronger version creates a direct relationship between evidence, change, behavior, measurement, and business risk.
What Is a Behavioral Mechanism?
The behavioral mechanism explains why the proposed change may influence customer behavior.
It is the link between the observation and the expected result.
Common mechanisms in ecommerce experiments include the following.
Reducing Uncertainty
أمثلة:
- Showing delivery dates earlier
- Clarifying return conditions
- Improving size and fit guidance
- Explaining differences between variants
- Showing compatibility information
- Making the final cost visible earlier
Reducing Cognitive Load
أمثلة:
- Simplifying variant selection
- Grouping related information
- Reducing unnecessary fields
- Improving bundle comparison
- Reducing the number of competing CTAs
- Organizing product information around customer questions
Increasing Information Scent
Information scent is the customer’s perception that a link or action will lead to relevant information.
أمثلة:
- Replacing “Learn More” with “View Size and Fit”
- Making filter labels more specific
- Improving category names
- Clarifying what happens after clicking a CTA
- Replacing vague navigation labels with product-oriented terms
Increasing Trust
أمثلة:
- Displaying verified reviews
- Clarifying payment security
- Showing authentic product information
- Explaining guarantees
- Making support access easier
- Presenting realistic delivery expectations
Improving Value Perception
أمثلة:
- Explaining bundle savings
- Connecting features to practical benefits
- Comparing product tiers
- Clarifying what is included
- Showing the difference between standard and premium options
Reducing Interaction Cost
أمثلة:
- Reducing unnecessary checkout fields
- Improving address autocomplete
- Making quantity editing easier
- Preserving cart information
- Improving error handling
- Reducing repeated data entry
Without a behavioral mechanism, the business may discover that one variation performed better but learn very little about why.
That makes future prioritization and knowledge transfer more difficult.
Choose Metrics Based on the Hypothesis
One of the most common A/B testing mistakes is selecting the easiest event to measure rather than the metric that represents the business question.
Suppose a sticky Add to Cart button increases CTA clicks.
That does not prove it increases purchases.
The sticky CTA may:
- Attract accidental interaction
- Encourage customers to add before selecting the correct variant
- Increase cart additions but also increase removals
- Create more checkout starts without more completed purchases
- Reduce Average Order Value
- Increase size-related returns
Ecommerce experiments need a clear metric hierarchy.
Primary Metric
The Primary Metric is the main outcome used to evaluate the hypothesis.
Possible Primary Metrics include:
- Purchase Rate
- Revenue per Visitor
- الإيراد لكل Session
- Add to Cart Rate
- معدل إتمام Checkout
- معدل Product Discovery
- Subscription Completion Rate
- Lead Completion Rate
The Primary Metric should be:
- Directly connected to the hypothesis
- Commercially relevant
- Sensitive enough to detect the expected effect
- Defined before the experiment begins
- Resistant to accidental manipulation
Not every experiment needs Purchase Rate as its Primary Metric.
A product-list filter experiment may use Product List to Product View Rate.
A size-selection experiment may use successful variant selection or Add to Cart.
But the team must understand how far the selected metric is from revenue.
Secondary Metrics
Secondary Metrics help explain how the customer journey changed.
For a Product Page test, they may include:
- Variant selection
- Size Guide interaction
- Product image interaction
- Review interaction
- Add to Cart
- Cart removal
- Checkout Start
- الشراء
Suppose the Variant improves Purchase Rate.
Secondary Metrics help answer why.
Did more users select a size?
Did Add to Cart improve?
Did fewer users return from Checkout to the Product Page?
Did the number of payment attempts change?
Without Secondary Metrics, the business may see a commercial result without understanding the behavior that produced it.
Guardrail Metrics
Guardrail Metrics identify unintended harm.
A variation can improve the Primary Metric and still damage the business.
أمثلة:
- Purchase Rate improves but Average Order Value declines
- Checkout Starts increase but payment errors rise
- Revenue increases but returns increase
- Add to Cart improves but cancellations increase
- Conversion Rate improves but page performance deteriorates
- Upsell acceptance increases but customer support demand rises
Common ecommerce Guardrails include:
- متوسط قيمة الطلب
- Gross Margin
- Refund Rate
- Return Rate
- Cancellation Rate
- معدل فشل الدفع
- Page Load Time
- Error Rate
- Customer Support Contacts
- Out-of-stock orders
- Customer satisfaction
A winner on one metric can still be a business loser.
Micro-Conversions Versus Business Outcomes
Micro-conversions are useful diagnostic signals.
Examples include:
- CTA clicks
- Opening a Size Guide
- Expanding reviews
- Selecting a filter
- Playing a product video
- Opening shipping information
- Using product comparison
These events help explain behavior.
But they are not automatically equivalent to business success.
A customer can open a Size Guide and still leave.
A customer can add a product to the cart and never begin Checkout.
A customer can begin Checkout and fail at payment.
Micro-conversions should usually be treated as intermediate steps, not final evidence of commercial impact.
A/B Testing for Low-Traffic Ecommerce Stores
Low traffic creates a real experimentation constraint.
Stores with limited traffic may need a long time to measure Purchase Rate reliably, especially when the expected effect is small.
The wrong response is to treat every high-frequency click metric as a business outcome.
Better options include:
- Testing larger changes with stronger expected effects
- Consolidating traffic onto fewer experiments
- Testing at a higher-frequency funnel stage
- Using behaviorally meaningful Micro-conversions
- Running usability research before development
- Implementing obvious usability fixes directly
- Using sequential research instead of forcing an underpowered test
- Prioritizing changes with strong evidence and low risk
A/B testing is not mandatory for every store or every decision.
Sometimes research and direct implementation are more appropriate.
Sample Size and Minimum Detectable Effect
An experiment should not begin without an estimate of the sample required to answer the question.
Sample requirements depend on:
- Baseline Conversion Rate
- الحد الأدنى للأثر القابل للاكتشاف
- القوة الإحصائية
- Significance threshold
- Number of Variants
- Traffic allocation
- Metric variability
What Is Minimum Detectable Effect?
Minimum Detectable Effect, or MDE, is the smallest effect the experiment is designed to detect under the selected statistical assumptions.
MDE is a planning input.
It is not the predicted result.
If an experiment is planned around a 10% relative MDE, that does not mean the team expects the Variant to produce a 10% uplift.
It means the experiment is designed to detect an effect of approximately that size.
Smaller effects generally require more users.
Relative Uplift Versus Absolute Uplift
Assume the baseline Conversion Rate is 5%.
A 10% relative uplift means:
5% × 1.10 = 5.5%
The absolute uplift is:
0.5 percentage points.
The distinction matters.
Relative percentages often appear larger, but absolute improvement is easier to connect to transactions and revenue.
Suppose the store has 100,000 eligible visitors:
- At 5%, it produces 5,000 purchases
- At 5.5%, it produces 5,500 purchases
- The estimated difference is 500 purchases
The business should then evaluate incremental revenue, gross margin, implementation cost, and operational impact.
القوة الإحصائية
Statistical Power is the probability that an experiment will detect a true effect of a specified size when that effect exists.
A low-powered test may produce an inconclusive result even when the variation has a real effect.
Therefore, a non-significant result does not automatically mean the change does nothing.
It may mean:
- There is no meaningful effect
- The effect is smaller than the MDE
- The sample is insufficient
- The metric is too noisy
- Exposure is weak
- The experiment ended too early
- Variance is higher than expected
Before declaring a test a failure, ask whether the experiment was capable of detecting the effect the business cared about.
How Long Should an Ecommerce A/B Test Run?
Experiment duration should not be determined only by watching the results dashboard.
The plan should consider:
- Required sample
- Weekly traffic
- Day-of-week behavior
- Weekend differences
- Payday patterns
- Campaign schedules
- العروض الترويجية
- Stock changes
- Seasonality
- New versus returning customer mix
A test that runs from Monday morning to Wednesday afternoon may not represent weekend customers.
A test launched during a major promotion may not represent normal purchasing behavior.
The experiment should cover the business cycles that matter to the store.
Do Not Stop at the First Positive Result
Teams frequently monitor a test every day and stop it when the result becomes positive.
This can lead to decisions based on temporary variation.
Before launch, define:
- Required sample
- Minimum runtime
- Stopping rule
- Primary Metric
- المؤشرات الحارسة (Guardrails)
- Eligibility
- Exclusion rules
- QA requirements
The rules should not change because the team likes the result.
Different experimentation platforms use different statistical approaches, including fixed-horizon, sequential, and Bayesian methods.
The business should understand the decision rules of the platform it uses.
Sample Ratio Mismatch
Sample Ratio Mismatch, or SRM, occurs when the actual allocation between groups differs unexpectedly from the planned allocation.
على سبيل المثال:
Planned Allocation
- Control: 50%
- Variant: 50%
Observed Allocation
- Control: 54%
- Variant: 46%
A small difference may occur naturally.
A statistically unusual difference may indicate a serious problem.
Possible causes include:
- Assignment errors
- Triggering differences
- Tracking loss
- Bot filtering
- Eligibility problems
- Page-loading failures
- Cookie issues
- Redirect errors
- Conflicts with other experiments
- Different exposure conditions
The concern is not merely that one group is larger.
The concern is that users included or excluded from the groups may be systematically different.
Do not interpret the test result before investigating unexplained SRM.
Assignment Versus Exposure
Assignment and exposure are not the same.
Assignment
The user was allocated to Control or Variant.
Exposure
The user actually encountered the changed element.
Imagine an experiment that modifies content near the bottom of a long Product Page.
Many users may be assigned to the Variant but leave before reaching the changed content.
The measured treatment effect may therefore be diluted.
However, analyzing only users who reach the element can create Selection Bias.
The correct approach depends on:
- Eligibility
- Randomization timing
- Triggering logic
- Exposure definition
- Experiment objective
- Analysis method
These rules should be planned before launch.
Multiple Metrics and False Positives
The more metrics, Variants, and segments a team analyzes, the more opportunities it has to find a positive-looking result caused by random variation.
This is especially risky when teams:
- Review dozens of segments
- Select only the positive Device
- Test many Variants simultaneously
- Search across different revenue definitions
- Compare every traffic channel
- Ignore the predefined Primary Metric
- Rewrite the hypothesis after reading the result
Exploratory analysis is still valuable.
But exploratory findings should be labeled as exploratory.
Important findings should be validated with a follow-up experiment.
Ecommerce Experiment QA
An experiment should pass four types of QA before launch.
Functional QA
Check that:
- The Variant displays correctly
- Buttons and links work
- Forms submit successfully
- Variants update correctly
- Cart behavior is preserved
- Checkout works
- Responsive layouts are correct
- No layout shift blocks content
- Accessibility is not reduced
Tracking QA
Check that:
- Experiment ID is recorded
- Variant assignment is recorded
- Primary Events fire correctly
- Events do not duplicate
- Revenue values are accurate
- العملة صحيحة
- Refund and cancellation logic is understood
- Browser and server events do not double count
- Exposure events fire at the correct time
Audience QA
تحقق من:
- Correct pages
- Correct Devices
- Correct markets
- Correct customer type
- Correct traffic allocation
- Correct exclusions
- Returning users remain in the same Variant
- No conflicts with other tests
Business QA
تحقق من:
- Prices remain accurate
- Promotions work correctly
- Inventory is available
- Delivery promises are valid
- Support teams understand the change
- Legal requirements are met
- Accessibility requirements are met
- The Variant does not create operational risk
SEO Considerations for A/B Testing
Some experiments modify indexable page content, URLs, internal links, Product descriptions, or category templates.
Tests may create SEO risks when they involve:
- Different URLs
- Server-side redirects
- Indexable content
- Canonical tags
- Structured Data
- Internal linking
- Product Page content
- Category Page content
General SEO principles for testing include:
- Do not use testing as a form of cloaking
- Use canonical tags appropriately
- Use temporary redirects when required
- Do not keep temporary experiments live indefinitely
- Avoid creating unnecessary duplicate URLs
- Involve SEO teams when tests affect crawlable content
High-Value Ecommerce Areas to Test
The strongest experiments come from evidence.
However, common opportunity areas include the following.
Product Page Experiments
- Variant selection
- Size and fit guidance
- رسائل التوصيل
- Return summaries
- Review presentation
- Product comparison
- Product image sequence
- Bundle structure
- Subscription presentation
Product Listing Page Experiments
- Default product ranking
- Filter structure
- Product-card information
- Variant visibility
- Stock messaging
- Price presentation
- Category diversity
- Recommendation logic
Cart Experiments
- Shipping thresholds
- الـUpsells
- Cart editing
- Coupon interaction
- تقديرات التوصيل
- Progress messaging
- Stock reservation messaging
Checkout Experiments
- Guest Checkout
- Field reduction
- Payment-method order
- معالجة الأخطاء
- Delivery selection
- Address autocomplete
- Order summary visibility
- Progress communication
Landing Page Experiments
- Message match
- Offer hierarchy
- Social Proof
- Product selection
- CTA structure
- Audience-specific content
- Pricing presentation
Do not test these areas simply because they are common.
Use research to determine which opportunity addresses the largest validated problem.
How to Prioritize an Ecommerce Experiment Roadmap
Use a prioritization framework based on:
الأثر
How much customer behavior or revenue could change?
الثقة
How strong is the evidence?
المجهود
How much design, development, tracking, QA, and maintenance are required?
Traffic Feasibility
Can the experiment reach a useful sample within a reasonable time?
Strategic Learning
Will the result teach the business something reusable?
المخاطر
Could the change harm revenue, customer trust, SEO, accessibility, or operations?
A cosmetic change may be easy to implement but produce limited learning.
A more substantial research-backed experiment may take longer but generate a more valuable business decision.
How to Interpret an Ecommerce A/B Test
At the end of the experiment, do not ask only:
Did the Variant win?
اسأل:
- Was the allocation valid?
- Was tracking reliable?
- Was there a Sample Ratio Mismatch?
- Was exposure defined correctly?
- Was the planned sample reached?
- Was the runtime representative?
- Did the Primary Metric improve?
- What does the Confidence Interval show?
- Did Guardrails remain healthy?
- Was the effect stable over time?
- Was it consistent across critical segments?
- Does the result support the proposed mechanism?
- Is the effect commercially meaningful?
- What decision should follow?
Possible Experiment Decisions
The result does not need to be reduced to “Winner” or “Loser.”
Possible decisions include:
Roll Out
The result is valid, stable, and commercially meaningful.
Segment-Specific Rollout
The effect is strong for a predefined audience but neutral or negative elsewhere.
Do Not Roll Out
The change does not produce sufficient value or harms Guardrails.
Fix and Rerun
Implementation, allocation, or tracking was invalid.
Run a Follow-Up Test
The result reveals a more specific question worth testing.
Gather More Research
The hypothesis was weak or the behavioral mechanism remains unclear.
Accept an Inconclusive Result
The test did not provide enough evidence to justify a decision.
An inconclusive experiment is not always a failure.
It can prevent an unjustified rollout and redirect the roadmap toward a stronger opportunity.
Building an Experimentation Knowledge Base
The long-term value of experimentation is not only the individual uplift.
It is the knowledge accumulated across tests.
For every experiment, record:
- المشكلة
- الأدلة
- Audience
- الفرضية
- Behavioral mechanism
- Primary Metric
- Secondary Metrics
- المؤشرات الحارسة (Guardrails)
- Sample plan
- مدة التشغيل
- QA findings
- Result
- Segment findings
- Decision
- Reusable learning
Over time, the business can identify patterns.
على سبيل المثال:
- Delivery uncertainty affects first-time mobile customers more strongly
- Size guidance improves selection but needs return-rate monitoring
- Discount-focused messages increase orders but reduce margin
- Generic urgency creates clicks without improving purchases
- Product comparison matters more in high-consideration categories
This knowledge makes future decisions faster and more precise.
الخلاصة
A/B testing for ecommerce is not a production line for random optimization ideas.
It is a structured decision system.
The strongest experimentation programs consistently connect:
Evidence → Problem → Hypothesis → Mechanism → Metric → Experiment → Decision
They do not test obvious bugs.
They do not celebrate every increase in clicks.
They do not treat Statistical Significance as the only condition for rollout.
They use experiments to determine which customer-experience changes create reliable, commercially meaningful improvement.
Mersad helps ecommerce teams build structured experimentation programs covering research, opportunity prioritization, hypothesis development, sample planning, experiment design, tracking, QA, analysis, and rollout decisions.
To review your current experimentation process or build an ecommerce testing roadmap:
Suggested Internal Links
- Ecommerce CRO Audit
- Conversion Rate Optimization Services
- Ecommerce Customer Psychology
- A/B Testing Statistics Explained
- Product Page Optimization
- تحسين Checkout
- GA4 Funnel Analysis
- Ecommerce Experimentation Roadmap
Suggested External References
- Google Search Central — Website Testing and SEO
- Microsoft Experimentation Platform — Sample Ratio Mismatch
- Microsoft Experimentation Platform — Online Controlled Experiments
- Optimizely Documentation — Experiment Planning and Minimum Detectable Effect
- Baymard Institute — Ecommerce UX Research