Most ecommerce teams watch the same dashboard every week.
Sessions.
Conversion Rate.
Orders.
Average Order Value.
Revenue.
ROAS.
All useful metrics.
But the problem starts when teams read them separately.
Conversion Rate goes up, so the website must be performing better.
Average Order Value goes up, so merchandising must be working.
Traffic grows, so acquisition must be improving.
Revenue goes up, so the overall strategy must be healthy.
Not necessarily.
One metric can improve while the commercial efficiency of the store gets worse.
That is where Revenue Per Session becomes useful.
Revenue Per Session — or RPS — answers a very simple question:
How much revenue does the average visit to your ecommerce store generate
It connects two metrics teams usually treat separately:
Conversion Rate
and
Average Order Value
Instead of asking only how many visitors purchased or how much each order was worth, RPS measures how much revenue the store generates from the traffic it already receives.
That makes it one of the most useful metrics for understanding ecommerce efficiency.
Shopify currently includes the closely related Revenue Per Visitor metric among its key ecommerce KPIs and defines it as the average revenue generated from site visitors. Its 2026 ecommerce metrics guidance also emphasizes that no single KPI should be read in isolation.
What Is Revenue Per Session
The formula is straightforward.
Revenue Per Session = Total Revenue ÷ Total Sessions
For example:
Monthly Revenue = SAR 500,000
Sessions = 200,000
Revenue Per Session:
500,000 ÷ 200,000 = SAR 2.50
Every session generated an average of SAR 2.50 in revenue.
That does not mean every visitor spent SAR 2.50.
Most visitors probably purchased nothing.
RPS distributes total revenue across all sessions to measure how efficiently the store monetizes its traffic.
Google Analytics defines a session as a period of interaction with a website or app. By default, a GA4 session times out after 30 minutes of inactivity, so if you calculate RPS using GA4 data, your denominator is based on GA4’s session definition rather than unique users.
This distinction matters because:
Revenue Per Session is not exactly the same as Revenue Per Visitor.
A visitor can create multiple sessions.
So before comparing numbers across dashboards, decide whether your metric is session-based or user-based and keep the definition consistent.
Why Revenue Per Session Is More Useful Than Conversion Rate Alone
Conversion Rate answers:
What percentage of sessions resulted in a purchase
Average Order Value answers:
How much revenue did the average order generate
RPS combines both.
Using a session-based ecommerce conversion definition:
Conversion Rate = Orders ÷ Sessions
and:
AOV = Revenue ÷ Orders
Multiply them:
Conversion Rate × AOV
becomes:
Orders ÷ Sessions × Revenue ÷ Orders
The Orders cancel out.
You are left with:
Revenue ÷ Sessions
Which is RPS.
So:
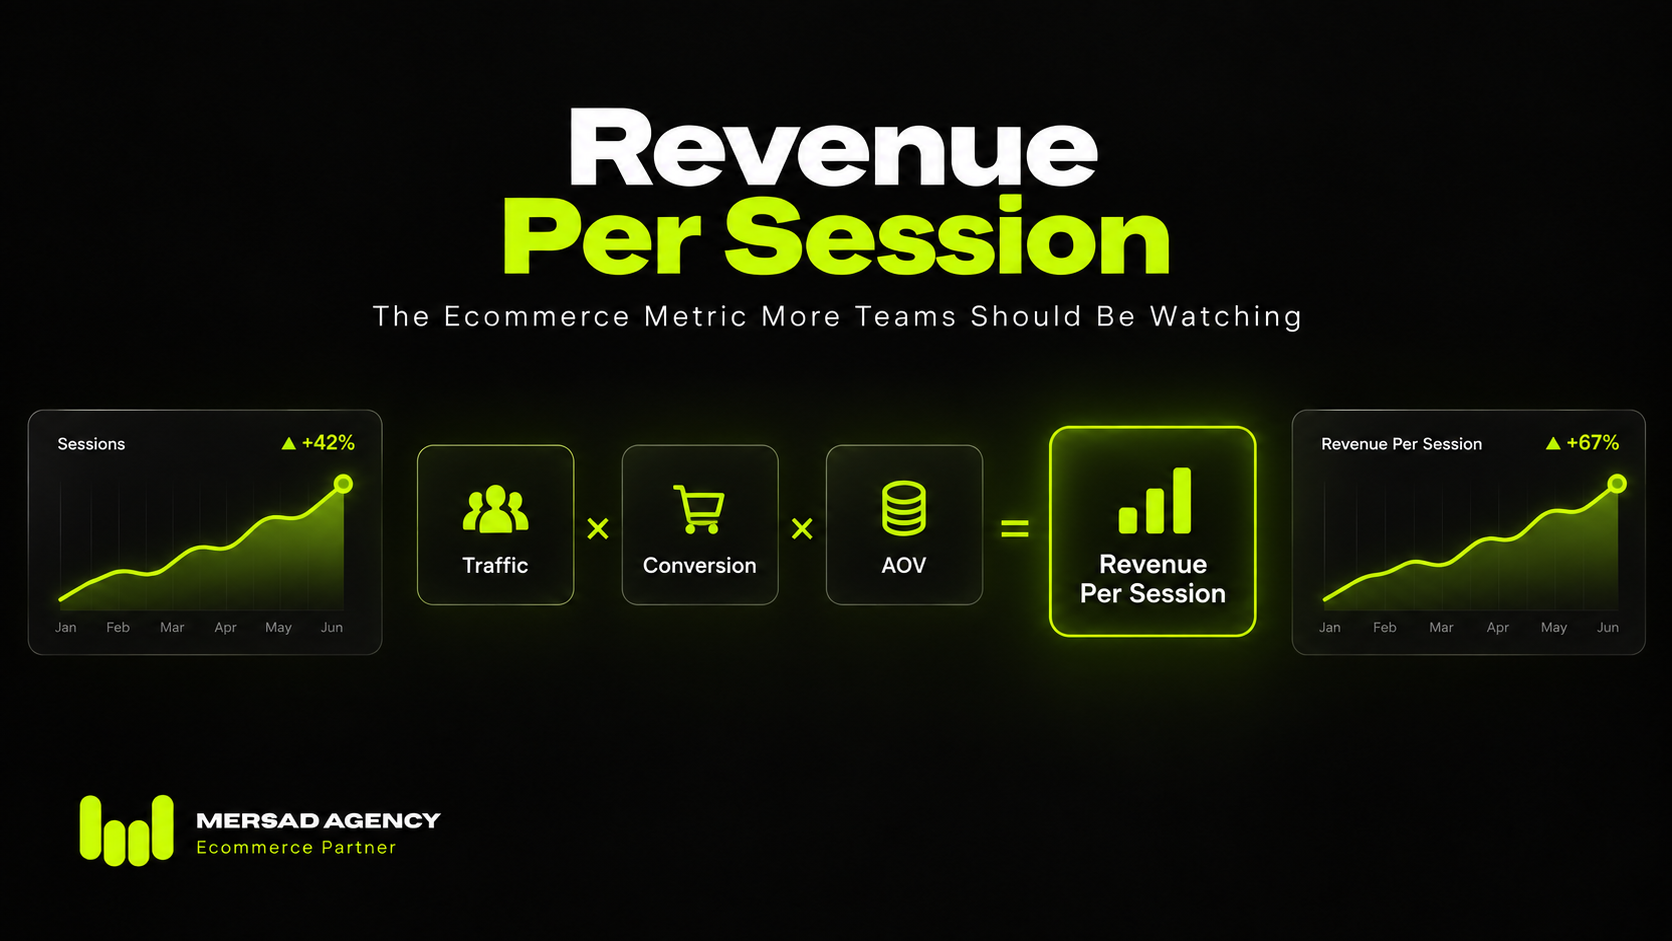
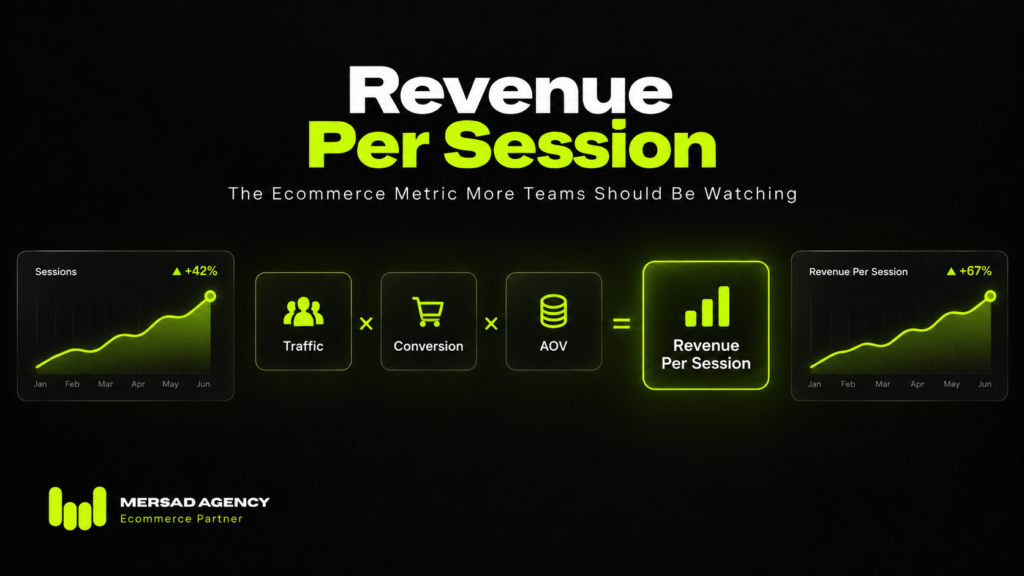
RPS = Conversion Rate × AOV
This relationship is what makes the metric useful.
Example Store A
Conversion Rate:
3%
AOV:
SAR 200
RPS:
0.03 × 200 = SAR 6
Example Store B
Conversion Rate:
2%
AOV:
SAR 350
RPS:
0.02 × 350 = SAR 7
Store A has the better Conversion Rate.
Store B generates more revenue from every session.
If you looked only at Conversion Rate, you would probably conclude that Store A is performing better.
Commercially, that conclusion would be incomplete.
Current 2026 ecommerce measurement guides are increasingly making the same point: conversion rate and AOV need to be interpreted together, and Revenue Per Visitor or Revenue Per Session captures both effects in a single efficiency metric.
A Higher Conversion Rate Can Still Produce Worse Performance
Imagine an ecommerce experiment.
Before:
Conversion Rate = 2%
AOV = SAR 500
RPS:
SAR 10
After:
Conversion Rate = 2.4%
AOV = SAR 380
RPS:
SAR 9.12
Conversion increased by 20%.
If Conversion Rate was the primary success metric, the experiment looks successful.
But every session now generates less revenue.
The website became better at producing orders while becoming worse at producing revenue.
That could happen because the experiment:
- Increased discount usage
- Shifted customers toward cheaper products
- Reduced bundle adoption
- Changed product mix
- Made low-value purchases easier
- Reduced premium-product selection
This is why a funnel metric should not automatically become the business outcome metric.
Shopify’s current checkout optimization guidance even describes a real replatforming case where performance was evaluated across the full funnel including sessions, conversion and revenue per session, rather than declaring success from one funnel metric alone.
The Opposite Can Also Happen
Suppose Conversion Rate drops.
Before:
Conversion Rate = 3%
AOV = SAR 250
RPS = SAR 7.50
After:
Conversion Rate = 2.7%
AOV = SAR 320
RPS = SAR 8.64
Conversion declined by 10%.
But RPS increased by 15.2%.
Calling this automatically a performance decline would also be wrong.
Maybe:
- More customers selected premium products
- Bundles increased
- Discounting decreased
- Upselling improved
- Product mix changed
- A low-value traffic segment disappeared
This doesn’t mean Conversion Rate is unimportant.
It means it needs context.
Revenue Per Session Turns Ecommerce Metrics Into a System
Instead of reading Conversion Rate and AOV separately, think of revenue like this:
Revenue = Sessions × Conversion Rate × AOV
This gives ecommerce teams three fundamental growth levers.
Traffic
How many sessions do we generate
Conversion
How efficiently do those sessions become orders
Order Value
How much revenue does each completed order generate
RPS combines the final two:
Revenue = Sessions × RPS
Now a useful question appears:
Are we growing because we are buying more traffic or because every session is becoming more valuable
Those are very different growth stories.
Scenario 1 Traffic Up Revenue Up RPS Down
Example:
Previous month:
100,000 sessions
SAR 500,000 revenue
RPS = SAR 5
Current month:
150,000 sessions
SAR 600,000 revenue
RPS = SAR 4
Revenue increased 20%.
At first glance, performance looks positive.
But traffic increased 50%.
Each session is now producing less revenue.
Possible explanations:
- Traffic quality declined
- More upper-funnel traffic entered the mix
- Paid acquisition expanded into weaker audiences
- Conversion declined
- AOV declined
- Product mix changed
This does not necessarily mean the growth strategy is wrong.
But it tells you acquisition volume is masking lower monetization efficiency.
Scenario 2 Traffic Flat Revenue Up
Previous:
100,000 sessions
SAR 500,000 revenue
RPS = SAR 5
Current:
100,000 sessions
SAR 650,000 revenue
RPS = SAR 6.50
RPS increased 30%.
Now the business is generating significantly more value from the same traffic volume.
Possible drivers:
Higher Conversion Rate
Higher AOV
Better product mix
Improved merchandising
Better checkout completion
Stronger returning-customer mix
Improved offer
This is usually much more interesting from a CRO perspective than simply reporting revenue growth.
Scenario 3 Conversion Up RPS Flat
Suppose Conversion Rate increases from:
2% → 2.4%
but RPS does not improve.
Something else offset the gain.
Most likely:
AOV fell.
The correct question becomes:
Why did customers become more likely to purchase while spending less when they did
That may lead you toward:
Discount usage
Product mix
Upselling
Cross-selling
Free-shipping thresholds
Bundling
Pricing
This is much more actionable than celebrating a Conversion Rate uplift in isolation.
Scenario 4 AOV Up RPS Down
This one confuses teams frequently.
AOV increases.
Great.
But RPS falls.
That means the higher basket value wasn’t enough to compensate for lower purchasing frequency.
Possible example:
Before:
CVR = 3%
AOV = SAR 300
RPS = SAR 9
After:
CVR = 2%
AOV = SAR 400
RPS = SAR 8
AOV increased 33%.
RPS declined 11%.
The store is getting larger orders but fewer of them.
You now need to understand why.
The RPS Diagnostic Matrix
Use this when reviewing ecommerce performance.
| Conversion Rate | AOV | RPS | What It May Mean |
|---|---|---|---|
| ↑ | ↑ | ↑ | Stronger commercial efficiency |
| ↑ | ↓ | ↑ | Conversion gain outweighs AOV decline |
| ↑ | ↓ | ↓ | More orders but weaker revenue efficiency |
| ↓ | ↑ | ↑ | Lower conversion offset by stronger basket value |
| ↓ | ↑ | ↓ | AOV gain isn’t enough to offset conversion loss |
| ↓ | ↓ | ↓ | Broad commercial deterioration |
| Flat | ↑ | ↑ | Merchandising or basket improvement |
| ↑ | Flat | ↑ | Conversion improvement |
| Flat | Flat | ↓ | Check revenue definition or data quality |
The point isn’t to automatically diagnose the cause from three numbers.
The point is to know where to investigate next.
Do Not Look at Blended Revenue Per Session Only
A store-wide RPS number is useful.
But blended averages hide problems.
Segment it.
At minimum, calculate RPS by:
Traffic Source
Paid Search
Paid Social
Organic Search
Direct
Affiliate
Referral
One channel may send enormous traffic but produce weak revenue per session.
Another may send less traffic but generate much more value from each visit.
This helps answer a more commercially useful question than:
Which channel sends the most traffic
Ask:
Which channel sends the most valuable traffic
Example Channel Analysis
| Channel | Sessions | Revenue | RPS |
|---|---|---|---|
| Paid Social | 100,000 | SAR 250,000 | SAR 2.50 |
| Paid Search | 40,000 | SAR 200,000 | SAR 5.00 |
| 20,000 | SAR 180,000 | SAR 9.00 | |
| Organic | 50,000 | SAR 250,000 | SAR 5.00 |
Paid Social is the biggest traffic source.
Email generates over three times more revenue from each session.
That does not mean you should stop Paid Social.
Different channels often serve different stages of the customer journey.
But it changes the conversation from volume to value.
Segment Revenue Per Session by Device
Mobile traffic often dominates ecommerce.
But traffic dominance doesn’t automatically mean revenue efficiency.
Compare:
Mobile RPS
Desktop RPS
Tablet RPS
A recent LinkedIn analysis of hundreds of millions of ecommerce sessions highlighted exactly this kind of device-level revenue gap, showing why teams should look beyond traffic share and compare the commercial yield of different devices.
If desktop RPS is SAR 8 and mobile RPS is SAR 3, don’t immediately redesign mobile.
Break the difference into:
Mobile Conversion Rate × Mobile AOV
versus
Desktop Conversion Rate × Desktop AOV
Now you can see whether the gap comes mainly from:
Conversion friction
Smaller mobile baskets
Traffic mix
Checkout behavior
Product discovery
Or a combination.
Segment RPS by Landing Page
This is especially valuable for paid media and SEO.
Imagine two landing pages.
Page A:
50,000 sessions
SAR 100,000 revenue
RPS = SAR 2
Page B:
15,000 sessions
SAR 90,000 revenue
RPS = SAR 6
Page A has over three times more traffic.
Page B produces three times more revenue per session.
That makes RPS useful for:
SEO prioritization
Landing-page optimization
Campaign evaluation
Content-to-commerce analysis
Merchandising decisions
The important question becomes:
Which pages convert attention into commercial value most effectively
Segment RPS by New vs Returning Customers
A blended RPS can also hide customer-mix changes.
Returning users often arrive with:
More product knowledge
More trust
Less purchase uncertainty
Existing brand familiarity
Potentially different basket behavior
So compare:
New-user RPS
Returning-user RPS
If overall RPS suddenly increases, maybe the website improved.
Or maybe returning-customer traffic simply represented a larger share of sessions.
Again:
Metric movement is not automatically causation.
Segment before concluding.
Use Revenue Per Session to Evaluate CRO Experiments
RPS can be extremely useful as a secondary or business-impact metric in experimentation.
Imagine Variation B improves:
Add to Cart +15%
Conversion Rate +8%
But reduces:
AOV -12%
Looking only at funnel metrics makes the test look promising.
Looking at RPS tells you whether the combined effect actually created more revenue per session.
That doesn’t mean every experiment should use RPS as the only primary metric.
Different experiments have different hypotheses.
For example:
A PDP information test may primarily target Add to Cart.
A checkout test may target Checkout Completion.
A merchandising experiment may target Revenue Per Session.
The important thing is to include a downstream commercial metric so a local uplift does not hide a business-level decline.
RPS Is Also Useful for Product and Category Analysis
Revenue Per Session doesn’t need to stay at the store level.
You can calculate similar efficiency measures for:
Categories
Landing pages
Collections
Traffic segments
Campaigns
Experiments
Products where attribution is meaningful
Suppose Category A receives:
100,000 sessions
SAR 300,000 revenue
RPS = SAR 3
Category B receives:
30,000 sessions
SAR 180,000 revenue
RPS = SAR 6
Category A drives more total revenue.
Category B monetizes its traffic twice as efficiently.
That raises useful questions:
Should Category B receive more merchandising exposure?
Could acquisition scale profitably?
Does Category A have a conversion problem?
Is Category B receiving stronger-intent traffic?
Does the difference come from AOV?
RPS points you toward better questions.
It doesn’t replace the investigation.
How to Calculate Revenue Per Session Correctly in GA4
The formula is easy.
The measurement setup is where problems happen.
Google Analytics defines Sessions and Total Revenue separately. GA4’s Total Revenue can include purchase revenue, subscriptions, in-app purchases and advertising revenue, minus refunds depending on the reporting context. For a pure ecommerce RPS metric, many teams may prefer Purchase Revenue ÷ Sessions rather than broader Total Revenue, depending on what the business wants to measure.
Before reporting RPS, define:
Your numerator
Are you using:
Gross sales
Net sales
Purchase revenue
Total revenue
Revenue after discounts
Revenue after refunds
Your denominator
Are you using:
Sessions
Users
Active users
New users
Ad clicks
Landing-page sessions
Do not casually compare:
Revenue per User
Revenue per Visitor
Revenue per Session
Revenue per Click
They are different metrics.
The Measurement Rule That Prevents Dashboard Arguments
Write the definition down.
For example:
RPS = GA4 Purchase Revenue ÷ GA4 Sessions
Then use the same definition:
Every month
Across channels
Across devices
Across experiments
Across reporting dashboards
The biggest RPS measurement mistake isn’t bad arithmetic.
It’s changing the numerator or denominator between reports.
Recent measurement guidance on RPV makes this same point: the denominator and revenue layer need to be defined consistently before the number becomes trustworthy.
RPS Does Not Tell You Whether Revenue Is Profitable
This is one of the most important limitations.
Imagine RPS increases because you introduced:
Heavy discounting
Free shipping
Aggressive bundles
Paid incentives
Revenue improves.
Profitability may not.
So RPS should not replace:
Gross margin
Contribution margin
CAC
ROAS
Refund rate
Return rate
Customer lifetime value
For many ecommerce businesses, an even more commercially useful extension is:
Contribution Margin Per Session
Instead of:
Revenue ÷ Sessions
use:
Contribution Margin ÷ Sessions
That tells you how much economically useful value each session creates after relevant variable costs.
RPS answers:
How efficiently do we monetize traffic
Contribution Margin Per Session moves toward:
How efficiently do we monetize traffic profitably
Different question.
Different metric.
Revenue Per Session Is Not a Diagnosis
This is also important.
Low RPS does not tell you what to change.
It tells you something about monetization efficiency.
To diagnose the cause, break it back down:
RPS = Conversion Rate × AOV
If RPS declines:
First check Conversion Rate.
Then AOV.
If Conversion Rate declined:
Break down the funnel.
Product View
Add to Cart
Checkout
Purchase
Then segment.
Source
Device
Landing Page
Product
New vs Returning
Geography
If AOV declined:
Investigate:
Product mix
Discount usage
Bundles
Upsells
Cross-sells
Pricing
Promotions
Free-shipping thresholds
The metric tells you where the commercial outcome changed.
Analysis tells you why.
A 15 Minute Revenue Per Session Analysis
Here’s a practical workflow.
Minutes 0 to 3
Pull:
Sessions
Revenue
Conversion Rate
AOV
Calculate RPS.
Compare with:
Previous period
Same period last year where appropriate
Minutes 3 to 6
Break RPS into:
Conversion Rate
AOV
Identify which component moved.
Minutes 6 to 10
Segment RPS by:
Source Medium
Device
New vs Returning
Landing Page
Minutes 10 to 13
Find the segments contributing most to the change.
Don’t look only at percentage movement.
Look at traffic volume too.
A segment representing 2% of traffic can have terrible RPS without materially affecting the business.
Minutes 13 to 15
Write the observation.
Not:
RPS decreased
Write:
RPS declined 14% primarily because Paid Social mobile sessions increased substantially while their Conversion Rate remained below the store average. AOV was broadly stable, suggesting the initial investigation should focus on traffic quality and the mobile post-click journey rather than basket value.
Now you have something actionable.
What Should You Optimize
Not RPS directly.
You optimize the mechanisms underneath it.
To improve Conversion Rate:
Improve traffic relevance
Landing-page alignment
Product discovery
PDP decision support
Trust
Cart experience
Checkout
Payments
Technical reliability
To improve AOV:
Bundles
Upsells
Cross-sells
Product recommendations
Free-shipping thresholds
Premium variants
Merchandising
Pricing architecture
And sometimes the correct move is to improve neither in isolation.
The goal is to improve the commercial system.
The Metric More Teams Should Put Next to Conversion Rate
Conversion Rate is still important.
AOV is still important.
Revenue is obviously important.
But teams frequently make bad decisions when those numbers are interpreted independently.
Revenue Per Session creates a useful bridge between them.
It tells you:
How much each visit is worth
Whether conversion improvements actually generate more revenue
Whether higher AOV compensates for lower conversion
Which channels bring commercially stronger traffic
Which devices monetize traffic better
Which landing pages create more value
Whether growth comes from more traffic or better traffic efficiency
And perhaps most importantly:
It prevents teams from celebrating a metric uplift that doesn’t translate into a better commercial outcome.
The goal of ecommerce optimization is not to maximize one percentage.
It is to make the economics of every visit better.
Start With These Four Numbers
Next time you review ecommerce performance, put these metrics next to each other:
Sessions
Conversion Rate
Average Order Value
Revenue Per Session
Then ask:
Did we grow because more people came
Did we grow because more people bought
Did we grow because buyers spent more
Or did the value of each session genuinely improve
That conversation is usually much more useful than asking whether Conversion Rate went up.
Need to Understand What Is Driving or Limiting Your Ecommerce Growth
Mersad combines ecommerce analytics, funnel analysis, customer behavior, CRO, merchandising, UX and experimentation to identify what is actually affecting revenue performance.
If your traffic is growing but the commercial return from that traffic isn’t, start with the data before increasing acquisition spend.
Explore our Ecommerce Insights
Or read:
Why Your Ecommerce Store Gets Traffic but No Sales
for a complete diagnostic framework for finding where revenue is being lost.
Frequently Asked Questions
What is Revenue Per Session in ecommerce
Revenue Per Session is the average revenue generated by each website session. It is calculated by dividing ecommerce revenue by total sessions over the same period.
How do you calculate Revenue Per Session
The formula is:
Revenue Per Session = Revenue ÷ Sessions
If an ecommerce store generates SAR 500,000 from 200,000 sessions, RPS equals SAR 2.50.
Is Revenue Per Session the same as Revenue Per Visitor
Not exactly. Revenue Per Session uses sessions as the denominator, while Revenue Per Visitor may use users or unique visitors depending on the reporting system. A single visitor can generate multiple sessions, so the definitions should not be mixed.
Why is Revenue Per Session useful
RPS combines Conversion Rate and Average Order Value into one commercial efficiency metric. It helps ecommerce teams understand how much revenue their traffic generates rather than looking at traffic, conversion and basket value separately.
Is Revenue Per Session better than Conversion Rate
It answers a different question. Conversion Rate measures how frequently sessions become purchases. RPS measures how much revenue each session generates. For commercial evaluation, they are often most useful when analyzed together.
Can Revenue Per Session increase while Conversion Rate decreases
Yes. If Average Order Value increases enough to offset the Conversion Rate decline, RPS can rise even while fewer sessions result in purchases.
Can Conversion Rate increase while Revenue Per Session decreases
Yes. Conversion Rate can improve while AOV falls enough to reduce total revenue generated per session.
Should RPS be the primary metric for A B testing
Not always. The primary metric should match the experiment hypothesis. However, RPS can be a valuable secondary or business-impact metric because it captures the combined effect of Conversion Rate and order value.
What is a good Revenue Per Session
There is no universal good RPS. It varies significantly by category, price point, product mix, geography, traffic source and customer mix. Comparing your RPS against your own historical performance and relevant segments is often more useful than using a generic benchmark.
How can ecommerce stores increase Revenue Per Session
RPS can increase through higher Conversion Rate, higher Average Order Value, or both. The correct optimization depends on whether the current limitation sits in traffic quality, the customer journey, checkout, merchandising, pricing or basket-building mechanisms.
Google Analytics defines a session as a period of interaction with your website or app.