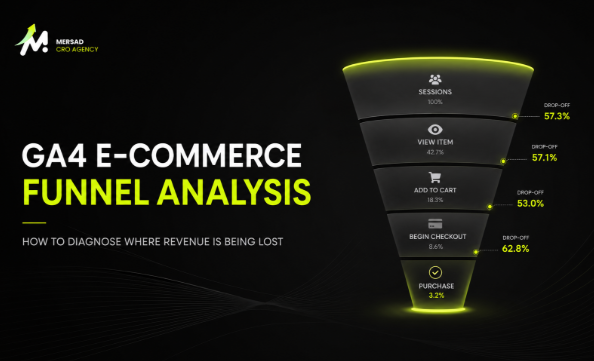
GA4 e-commerce funnel analysis helps teams understand how users progress from product discovery to purchase. It can reveal where progression weakens, which segments contribute most to the loss, and whether the issue is related to traffic, product relevance, UX, checkout, operations, or measurement.
However, a funnel is only useful when the events are implemented correctly and the business question is clear. A beautifully designed exploration built on duplicated purchases, missing product views, inconsistent item IDs, or incorrect currencies can produce confident but false conclusions.
This guide explains how to validate the measurement, build a useful funnel, segment it correctly, interpret drop-offs responsibly, and turn the findings into prioritized actions.
What an E-commerce Funnel Can and Cannot Tell You
A funnel tells you how many eligible users or sessions progress from one defined step to another. It is useful for locating a weak transition.
For example:
- many users view product lists but few open product pages;
- many users view products but few add to cart;
- many users add products but do not begin checkout;
- many users begin checkout but do not purchase.
The funnel does not automatically explain why the drop occurs.
A low product-view-to-cart rate may reflect:
- weak product relevance;
- insufficient product information;
- high price;
- unavailable sizes;
- delivery uncertainty;
- low-intent traffic;
- tracking defects.
A low checkout completion rate may reflect:
- payment failure;
- unexpected shipping cost;
- delivery restrictions;
- form errors;
- forced account creation;
- missing payment methods;
- technical issues;
- a normal research behavior where users check total cost and return later.
The funnel identifies where to investigate. Diagnosis requires segmentation and supporting evidence.
Step 1: Define the Business Question
Do not begin by adding every available event to a funnel.
Start with a decision.
Examples:
- Why did purchases decline after traffic increased?
- Why is mobile product-view-to-cart performance weak?
- Why does one campaign generate checkout starts but few purchases?
- Why does a category receive traffic without revenue?
- Which checkout step creates the largest preventable loss?
- Did a recent change improve progression?
- Which product pages deserve qualitative research?
A clear business question determines:
- the funnel steps;
- the audience;
- the date range;
- the segments;
- the comparison;
- the success metric.
Step 2: Understand the Recommended GA4 E-commerce Events
Google Analytics supports recommended e-commerce events. A common journey may use:
view_item_list;select_item;view_item;add_to_cart;remove_from_cart;view_cart;begin_checkout;add_shipping_info;add_payment_info;purchase;refund.
Not every store needs every event in the same funnel. The implementation should reflect actual user interactions.
view_item_list
Use this when a user views a list of items, such as a category, search results, recommendation carousel, or collection.
Important parameters may include:
item_list_id;item_list_name;- item identifiers;
- item names;
- price;
- category;
- index.
Questions:
- Does it fire when the list is actually visible?
- Does infinite scroll create repeated or inflated views?
- Are recommendation carousels distinguishable?
- Is the list name consistent?
select_item
Use this when a user selects an item from a list.
Questions:
- Does it fire for product-card clicks?
- Does quick add incorrectly count as selection?
- Is the source list preserved?
- Can the team calculate list click-through?
view_item
Use this when a user views a product detail.
Questions:
- Does it fire once?
- Does a variant change create extra product views?
- Are product IDs stable?
- Is the price correct?
- Is the variant captured?
add_to_cart
Use this after an item is successfully added.
Questions:
- Does it fire only after success?
- Does it include the selected variant?
- Does it fire twice due to app and theme tracking?
- Is quantity correct?
- Is quick add measured consistently?
view_cart
Use this when the cart is viewed.
Questions:
- Does a cart drawer count as a view?
- Is the definition consistent?
- Does opening and closing repeatedly inflate counts?
- Does the event include the current cart items?
begin_checkout
Use this when the user starts checkout.
Questions:
- Does it fire on the checkout button or after the checkout page loads?
- Can payment redirects create duplicates?
- Is the cart value preserved?
- Are coupons and shipping values handled correctly?
add_shipping_info
Use this when shipping information or method is added.
Questions:
- Does the store have a meaningful shipping step?
- Is the shipping tier captured?
- Does editing the method create duplicates?
- Is the timing consistent across express checkout?
add_payment_info
Use this when payment information or method is added.
Questions:
- Is the payment type captured?
- Does a third-party gateway allow consistent tracking?
- Is the event sent before or after validation?
- Are failed attempts distinguishable?
purchase
Use this when the transaction is completed.
Questions:
- Is
transaction_idunique? - Is the event deduplicated?
- Is revenue correct?
- Is currency correct?
- Are shipping and tax consistent?
- Are all items included?
- Can page refreshes trigger another purchase?
- Are server-side and client-side sources reconciled?
Step 3: Validate the Implementation
A funnel should not be analyzed until the event model is tested.
Validation method
Use several layers:
- platform order data;
- GA4 reports;
- DebugView;
- browser data layer;
- Google Tag Manager preview;
- server logs where relevant;
- controlled test orders.
Reconciliation checks
Compare:
- total orders;
- total revenue;
- transaction IDs;
- item quantity;
- currency;
- discounts;
- refunds;
- payment methods;
- shipping methods.
A small discrepancy may be explainable by consent, ad blockers, processing time, cancellations, or refunds. A large or inconsistent discrepancy requires investigation.
Duplication checks
Look for:
- repeated
purchaseevents; - both native app and custom tag firing;
- route changes in single-page applications;
- page refreshes;
- duplicate data-layer pushes;
- client-side and server-side duplication;
- multiple GTM containers.
Missing-event checks
Look for:
- product templates without
view_item; - quick-add interactions without
add_to_cart; - express checkout bypassing events;
- payment gateways breaking the sequence;
- mobile app or webview gaps;
- consent behavior;
- browser-specific failures.
Parameter checks
Confirm:
- item IDs are consistent across events;
- product names are stable;
- variants are distinguishable;
- prices are numeric;
- currency uses a consistent code;
- list names are useful;
- coupon values are populated correctly;
- quantities are accurate.
Step 4: Choose the Correct Funnel Scope
A GA4 funnel can be open or closed.
Closed funnel
Users must enter through the first step.
Useful when:
- the journey has a defined starting point;
- you want to compare users who began in the same place;
- exposure to the first step matters.
Risk:
- users entering later are excluded even if their behavior is relevant.
Open funnel
Users can enter at any step.
Useful when:
- users may legitimately start at different points;
- the journey is non-linear;
- you want to understand progression from the first observed eligible step.
Risk:
- interpretation may become less intuitive.
You should also decide whether the funnel is user-scoped or session-scoped. A user may view a product in one session and purchase in another. A session funnel is useful for immediate conversion efficiency, while a user funnel may better reflect longer consideration cycles.
Step 5: Build Focused Funnels
Product discovery funnel
Possible steps:
view_item_listselect_itemview_item
Use it to evaluate:
- category relevance;
- search-result quality;
- product-card clarity;
- merchandising;
- filtering;
- list placement.
Questions:
- Which lists generate the strongest product engagement?
- Which high-traffic lists have weak selection?
- Does mobile performance differ?
- Are search results more effective than category pages?
- Which recommendation modules create meaningful engagement?
Product decision funnel
Possible steps:
view_itemadd_to_cart
Use it to evaluate:
- product relevance;
- content sufficiency;
- price and offer;
- variant usability;
- delivery clarity;
- trust;
- stock.
Questions:
- Which products have high views and low cart additions?
- Are low-performing products concentrated in a category?
- Does the problem affect mobile?
- Do products with missing reviews or information underperform?
- Are unavailable variants creating false product views?
Cart-to-checkout funnel
Possible steps:
add_to_cartview_cartbegin_checkout
Use it to evaluate:
- cart visibility;
- cart drawer behavior;
- unexpected cost;
- upsell distraction;
- coupon behavior;
- checkout entry.
Questions:
- Are users adding items but failing to view the cart?
- Does the cart drawer create a different path?
- Are shipping thresholds confusing?
- Do coupon fields trigger exits?
- Are cart changes creating errors?
Checkout funnel
Possible steps:
begin_checkoutadd_shipping_infoadd_payment_infopurchase
Use it to evaluate:
- form progression;
- shipping;
- payment;
- technical reliability;
- trust;
- order completion.
Questions:
- Which step has the largest loss?
- Does the loss vary by payment method?
- Does mobile underperform?
- Are specific countries or delivery areas affected?
- Do gateway redirects break measurement?
- Did a recent checkout update change progression?
Step 6: Use the Right Denominator
A rate is meaningful only when the denominator matches the question.
Examples:
Product-list click-through rate
select_item users / view_item_list users
Product-view rate
view_item users / view_item_list users
Add-to-cart rate from product views
add_to_cart users / view_item users
Checkout-start rate from cart
begin_checkout users / view_cart users
Checkout completion rate
purchase users / begin_checkout users
Session conversion rate
purchasing sessions / total sessions
These rates answer different questions. Do not compare them as if they are interchangeable.
Also decide whether to use users, sessions, events, or items. Event counts can be inflated by repeated behavior. User counts can hide quantity. Item counts can help analyze product performance but require stable item data.
Step 7: Segment the Funnel
The most commercially important insight is often not the average rate but the segment that explains the change.
Device
Compare:
- mobile;
- desktop;
- tablet.
Questions:
- Is mobile weaker at product selection, cart, or checkout?
- Did mobile traffic share increase?
- Are sticky elements obstructing controls?
- Are payment methods equally usable?
- Are load times or layout shifts worse?
Source and campaign
Compare:
- paid social;
- paid search;
- organic search;
- email;
- direct;
- referral;
- affiliates;
- influencers.
Questions:
- Does a campaign bring weak-intent traffic?
- Is message match poor?
- Are users landing on the correct page?
- Are promotions consistent?
- Does one channel create many carts but few purchases?
Landing page
Questions:
- Which landing pages generate high traffic but weak product views?
- Which pages produce strong checkout behavior?
- Does informational content assist conversion later?
- Are campaign-specific pages converting their intended audience?
New and returning users
Returning users may show:
- higher trust;
- faster checkout;
- stronger product familiarity;
- saved-cart behavior.
New users may need more:
- explanation;
- proof;
- delivery information;
- risk reduction.
Geography
Questions:
- Are shipping options available?
- Are delivery times competitive?
- Are payment methods relevant?
- Is language appropriate?
- Are taxes or duties unexpected?
- Are service restrictions clear?
Product and category
Questions:
- Which high-view products generate no revenue?
- Which products drive carts but fail at purchase?
- Are return-prone products converting aggressively?
- Are out-of-stock variants distorting performance?
- Does price band affect progression?
Step 8: Compare Periods Carefully
When comparing periods, control for:
- weekday mix;
- seasonality;
- promotions;
- campaign spend;
- traffic mix;
- product availability;
- price changes;
- site releases;
- tracking changes;
- holidays;
- delivery changes.
Calculate both absolute and percentage change.
Example:
- previous purchases: 1,000;
- current purchases: 850;
- absolute change: -150;
- percentage change: -15%.
Then identify contribution.
If mobile paid social lost 120 purchases while all other segments lost 30, that segment explains most of the decline and deserves focused investigation.
Step 9: Connect the Funnel to Revenue
Funnel progression should be connected with business outcomes.
A segment with low conversion may still generate strong revenue if it has high order value. A segment with high conversion may have low margin or high cancellation.
Review:
- revenue;
- revenue per session;
- average order value;
- quantity;
- margin where available;
- refunds;
- cancellations;
- repeat purchase;
- payment failure;
- customer-support cost.
The objective is not to maximize a single step at any cost.
Step 10: Triangulate with Qualitative Evidence
Once the weak step is identified, collect evidence that may explain it.
If product-view-to-cart is weak
Review:
- product-page recordings;
- variant interactions;
- image usage;
- size-guide usage;
- delivery questions;
- reviews;
- product comparison behavior;
- support tickets;
- out-of-stock patterns.
If cart-to-checkout is weak
Review:
- shipping-threshold messaging;
- coupon field behavior;
- cart edits;
- upsell modules;
- hidden costs;
- login prompts;
- technical errors.
If checkout completion is weak
Review:
- form errors;
- payment failures;
- shipping restrictions;
- payment-method coverage;
- forced account creation;
- slow redirects;
- trust concerns;
- session expiration.
A GA4 funnel should guide the research sample.
Common GA4 Funnel Mistakes
Mistake 1: Using unvalidated events
The result is precise-looking but unreliable.
Mistake 2: Adding every event
A long funnel can create noise and make interpretation difficult.
Mistake 3: Ignoring event definitions
Teams may use the same event name for different moments.
Mistake 4: Mixing users, sessions, events, and items
Different denominators create different answers.
Mistake 5: Treating drop-off as a problem by default
Some users research, compare, return later, or intentionally leave.
Mistake 6: Ignoring traffic mix
A changing audience can change every downstream rate.
Mistake 7: Looking only at percentages
Absolute volume and revenue contribution matter.
Mistake 8: Ignoring product and operational data
Stock, price, delivery, and payment availability can explain the funnel.
Mistake 9: Claiming causation
The funnel identifies association and location, not proof of cause.
Mistake 10: Building dashboards without decisions
A report is valuable only when it supports action.
Turning Funnel Findings into Actions
Use a structured finding format.
Issue
Mobile product-view-to-cart rate declined for a high-traffic category.
Evidence
- 22% relative decline in mobile add-to-cart rate;
- stable desktop performance;
- repeated variant-selection errors in recordings;
- support questions about sizing;
- unavailable sizes on high-view products.
Business impact
The category contributes a significant share of paid traffic and revenue.
Recommendation
Improve size selection, clarify unavailable options, place size guidance near the selector, and update campaign landing rules for low-stock products.
Validation
- fix incorrect unavailable states directly;
- monitor error rate;
- test the redesigned selector if traffic is sufficient;
- track size-guide usage;
- measure add-to-cart rate and purchase rate;
- use refund rate as a guardrail.
This structure prevents the team from jumping from a funnel rate to a generic redesign.
Building a GA4 E-commerce Funnel Report
A practical report may include:
Executive view
- sessions;
- users;
- purchases;
- revenue;
- conversion rate;
- revenue per session;
- AOV;
- period change.
Funnel view
- users at each step;
- step rate;
- drop-off count;
- period comparison.
Segment view
- device;
- source;
- campaign;
- landing page;
- new/returning;
- geography;
- category.
Product view
- product views;
- add-to-cart users;
- purchases;
- revenue;
- view-to-cart rate;
- cart-to-purchase rate;
- stock context.
Checkout view
- checkout starts;
- shipping progression;
- payment progression;
- purchases;
- payment method;
- errors where available.
Data-quality view
- analytics orders versus platform orders;
- revenue discrepancy;
- duplicate transactions;
- missing item data;
- implementation notes.
Practical Funnel Analysis Checklist
Before analysis
- Define the business question.
- Define the audience.
- Validate event firing.
- Reconcile purchases and revenue.
- Confirm item IDs.
- Document limitations.
- Choose user or session scope.
- Choose open or closed funnel.
- Confirm date comparison.
During analysis
- Review absolute and percentage change.
- Identify where the change begins.
- Segment before concluding.
- Check traffic mix.
- Check product mix.
- Check stock and promotion context.
- Check device contribution.
- Identify high-traffic zero-revenue segments.
- Review revenue, not only conversion.
- Create hypotheses, not causes.
After analysis
- Select qualitative samples.
- Write evidence-based findings.
- Separate direct fixes from experiments.
- Assign owners.
- Define tracking requirements.
- Define acceptance criteria.
- Define success and guardrail metrics.
- Document missing evidence.
- Set a review date.
Worked Example: Finding the Source of a Checkout Decline
Assume the store reports that checkout completion fell from 54% to 46% over two weeks.
A weak analysis stops at the overall rate. A stronger analysis follows this sequence.
1. Validate the event model
Confirm that begin_checkout and purchase are firing consistently. Compare transaction counts with the commerce platform. Review whether a recent checkout or payment release changed tracking.
2. Calculate absolute impact
Suppose checkout starts increased from 10,000 to 12,000, while purchases changed from 5,400 to 5,520. Purchases still increased by 120, but completion efficiency declined. This distinction matters. The store has not lost purchases in absolute terms, but it may be spending more to acquire each one.
3. Segment the change
The overall decline may be concentrated in:
- mobile;
- one payment method;
- one country;
- one campaign;
- new users;
- a specific shipping method.
If mobile paid-social users explain most of the additional checkout starts and have low purchase completion, the issue may begin with traffic quality or message match rather than checkout design.
4. Check operational context
Review:
- payment failure logs;
- shipping changes;
- delivery restrictions;
- stock changes;
- promotion terms;
- coupon behavior;
- platform incidents.
5. Collect qualitative evidence
Select recordings from the affected segment. Review error messages, repeated field entry, payment retries, back navigation, and exits after shipping cost.
6. Write the finding
Observation:
Mobile checkout completion declined primarily for new paid-social users after a campaign and payment-method change.
Hypotheses:
- campaign traffic is lower intent;
- payment UX is weaker on mobile;
- the selected payment method has a technical failure;
- shipping expectations are not aligned with the ad.
The analysis has now produced specific research and implementation tasks rather than a generic checkout-redesign request.
Advanced GA4 Considerations
Attribution versus funnel behavior
GA4 attribution reports and funnel explorations answer different questions. Attribution estimates how touchpoints receive credit. Funnel analysis evaluates progression through defined behaviors. Do not assume that a channel with low last-click revenue has no role in discovery, and do not assume that a channel with many funnel entries caused the final purchase.
Cross-device behavior
Users may research on mobile and purchase on desktop. User-ID and Google signals can improve some cross-device understanding, but coverage and privacy limitations remain. Treat cross-device conclusions carefully.
Consent and missing data
Consent choices, browser restrictions, ad blockers, and modeled data can affect observed behavior. Document whether the funnel represents all customers or only measurable customers.
Event cardinality and naming
Inconsistent item IDs, category names, list names, or custom parameters can fragment reports. Governance matters. A tracking plan should define naming, scope, type, allowed values, and ownership.
Time to purchase
Some products have a longer consideration cycle. A same-session funnel may understate the role of product views, wishlists, and repeated visits. Compare session-based and user-based views where appropriate.
Refunds and cancellations
A completed purchase is not always retained revenue. Connect GA4 with platform, CRM, or warehouse data when evaluating customer quality, cancellations, and refunds.
From Funnel Analysis to a Measurement Plan
A measurement plan should include:
Business objective
Example: improve mobile checkout completion without reducing AOV or increasing payment failures.
Questions
- Which mobile step creates the largest loss?
- Which payment methods underperform?
- Are errors technical or behavioral?
- Which sources contribute the most affected users?
Events
begin_checkout;add_shipping_info;add_payment_info;purchase;- payment-error event;
- form-error event.
Dimensions
- device;
- source/medium;
- campaign;
- landing page;
- country;
- payment method;
- shipping method;
- new/returning;
- product category.
Metrics
- users entering each step;
- step completion;
- purchases;
- revenue;
- revenue per checkout start;
- AOV;
- payment failure rate;
- support contacts.
Guardrails
- cancellation rate;
- refund rate;
- page speed;
- error rate;
- average order value.
QA
- controlled test orders;
- successful and failed payment paths;
- mobile and desktop;
- guest and logged-in;
- coupon and non-coupon;
- multiple currencies where relevant.
This plan makes the analysis repeatable and prevents the dashboard from becoming detached from implementation.
Recommended Dashboard Views
1. Executive summary
Show:
- sessions;
- purchases;
- revenue;
- conversion rate;
- revenue per session;
- AOV;
- period comparison.
2. Funnel table
For every step, show:
- users;
- progression rate;
- drop-off count;
- absolute change;
- percentage change.
3. Contribution analysis
Show which segments contribute most to:
- lost purchases;
- lost revenue;
- increased checkout starts;
- high traffic with zero revenue.
4. Data-quality status
Show:
- order reconciliation;
- revenue discrepancy;
- duplicate transactions;
- missing item parameters;
- known implementation limitations.
5. Action tracker
Show:
- finding;
- evidence;
- priority;
- owner;
- status;
- success metric;
- review date.
The dashboard should support decisions, not simply display every available metric.
When GA4 Is Not Enough
GA4 is valuable, but some questions require other systems.
Use:
- commerce-platform data for orders, refunds, cancellations, and inventory;
- payment-provider logs for failures;
- CRM data for customer quality and lifecycle;
- search logs for unmet product demand;
- support data for recurring uncertainty;
- experimentation platforms for controlled exposure;
- session recordings for interaction patterns;
- performance monitoring for technical instability;
- warehouse or BI data for profitability and long-term value.
The strongest diagnosis combines systems instead of forcing every question into one tool.
Frequently Asked Questions
Which GA4 funnel should I build first?
Start with the funnel that answers the current business question. A broad product-view-to-purchase funnel can provide orientation, but focused funnels are usually more actionable.
Should I use users or sessions?
Use sessions for immediate journey efficiency and users for cross-session progression. The choice should match the decision.
Why do GA4 purchases not match platform orders?
Possible reasons include consent, ad blockers, duplicate or missing events, processing differences, refunds, cancellations, cross-domain issues, server/client conflicts, or implementation errors. Reconcile the systems before using the funnel for decisions.
Can GA4 explain why users abandon checkout?
GA4 can show where abandonment is concentrated. Use payment logs, form-error tracking, recordings, surveys, support data, and technical monitoring to investigate why.
Is a low step rate always bad?
No. The expected rate depends on traffic intent, product, price, market, and journey. Compare trends and segments rather than relying on a universal benchmark.
How often should the funnel be reviewed?
Review it regularly and after meaningful changes to campaigns, themes, checkout, payment methods, shipping, products, or tracking.
Conclusion
GA4 e-commerce funnel analysis is most valuable when it is treated as a diagnostic process rather than a dashboard exercise. The analyst must first validate the event model, define the business question, select the correct funnel scope, use the right denominator, segment the results, and connect progression with revenue and operations.
The funnel identifies where to investigate. Qualitative research, technical evidence, campaign context, product data, and operational information help explain why. The final output should become a prioritized action, not another report.
When this process is repeated consistently, GA4 becomes more than a reporting tool. It becomes part of a commercial system for identifying revenue leaks, improving customer experience, and making better e-commerce decisions.
Work With Mersad
A reliable GA4 funnel should do more than visualize drop-off. It should help your team identify where revenue loss is concentrated, which audiences and journeys contribute most, and what evidence is still needed before making a decision.
Mersad helps e-commerce teams validate GA4 implementation, analyze funnel performance, connect analytics with customer behavior and operational context, and turn findings into a prioritized CRO roadmap.
References
- Google Search Central, “Creating Helpful, Reliable, People-First Content”: https://developers.google.com/search/docs/fundamentals/creating-helpful-content
- Google Search Essentials: https://developers.google.com/search/docs/essentials
- Nielsen Norman Group, “How to Conduct a Heuristic Evaluation”: https://www.nngroup.com/articles/how-to-conduct-a-heuristic-evaluation/
- Baymard Institute, E-commerce Checkout Usability Research: https://baymard.com/research/checkout-usability
- Baymard Institute, Product Page UX Research: https://baymard.com/research/product-page
- Google Analytics, Ecommerce in GA4: https://support.google.com/analytics/answer/14430645?hl=en
- Google Analytics, Recommended Events: https://support.google.com/analytics/answer/9267735?hl=en